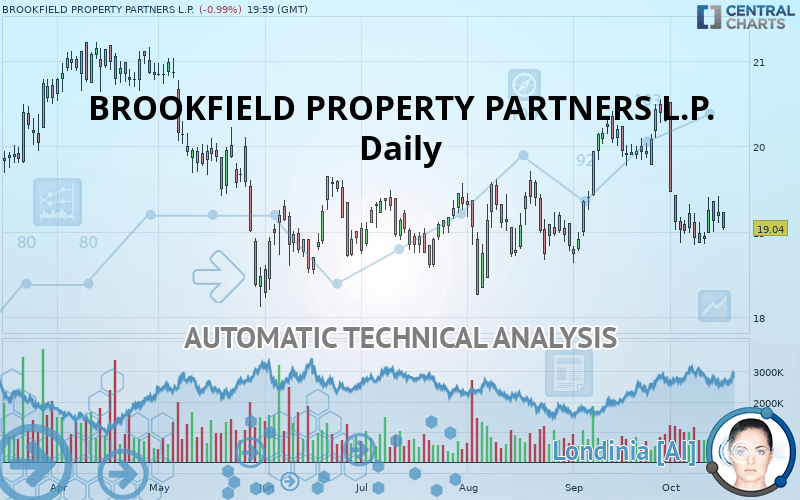
BROOKFIELD PROPERTY PARTNERS L.P. - Daily - Technical analysis published on 10/17/2019 (GMT)
- Who voted?
- 202
- 0
I am delighted to see that my first price objective has been achieved. I hope you've taken advantage of it.
Click here for a new analysis!
Click here for a new analysis!
- Timeframe : Daily
- - Analysis generated on
- Status : TARGET REACHED

BROOKFIELD PROPERTY PARTNERS L.P. Chart
Summary of the analysis
Trends
Court terme:
Strongly bearish
De fond:
Bearish
Technical indicators
22%
39%
39%
My opinion
Bearish under 19.58 USD
My targets
18.98 USD (-0.32%)
18.27 USD (-4.04%)
My analysis
BROOKFIELD PROPERTY PARTNERS L.P. is part of a very strong bearish trend. Traders may consider trading only short positions (for sale) as long as the price remains well below 19.58 USD. The next support located at 18.98 USD is the next bearish objective to target. A bearish break of this support would revive the bearish momentum. The bearish movement could then continue towards the next support located at 18.27 USD. Below this support, sellers could then target 17.70 USD.
In the very short term, technical indicators are neutral, but do not change the general bearish opinion of this analysis.
FORCE
0
10
4.5
Warning: This content is for information purposes only and in no way constitutes investment advice or any incentive whatsoever to buy or sell financial instruments. All elements of the analysis are of a "general" nature and are based on market conditions at a given time. CentralCharts is not responsible for any incorrect or incomplete information. Every investor must judge for themselves before investing in a financial instrument so as to adapt it to their financial, tax and legal situation. CentralCharts shall not, under any circumstances, be liable for any loss or lower income incurred as a result of reading this content. Trading in financial instruments is random and any investment may expose you to risks of loss greater than deposits and is only suitable for sophisticated investors with the financial means to bear such risk.
This analysis was given by Vincent Launay.
Additional analysis
Quotes
The BROOKFIELD PROPERTY PARTNERS L.P. price is 19.04 USD. The price registered a decrease of -0.99% on the session and was between 19.02 USD and 19.23 USD. This implies that the price is at +0.11% from its lowest and at -0.99% from its highest.19.02
19.23
19.04
Here is a more detailed summary of the historical variations registered by BROOKFIELD PROPERTY PARTNERS L.P.:
Near a new LOW record (1 month)
Type : Bearish
Timeframe : Weekly
Technical
A technical analysis in Daily of this BROOKFIELD PROPERTY PARTNERS L.P. chart shows a bearish trend. 71.43% of the signals given by moving averages are bearish. This bearish trend is supported by the strong bearish signals given by short-term moving averages. An assessment of moving averages reveals a bullish signal that could impact this trend:
Bullish price crossover with Moving Average 100
Type : Bullish
Timeframe : Daily
The technical indicators are generally neutral. They do not provide relevant information on the direction of future price movements.
Other results related to technical indicators were also found by the Central Indicators scanner:
Pivot points : price is under support 1
Type : Neutral
Timeframe : Daily
Price is back over the pivot point
Type : Bullish
Timeframe : Weekly
An analysis of the price chart with the Central Patterns scanner (detector of chart patterns and resistances and supports) shows a result that can have an impact on the price change:
Near support of channel
Type : Bullish
Timeframe : Daily
For a small rebound in the very short term, the Central Candlesticks scanner currently notes the presence of this bullish pattern in Japanese candlesticks:
Bullish harami
Type : Bullish
Timeframe : Daily
ProTrendLines
S3
S2
S1
R1
R2
R3
Price
| S3 | S2 | S1 | Price | R1 | R2 | R3 | |
|---|---|---|---|---|---|---|---|
| ProTrendLines | 17.70 | 18.27 | 18.98 | 19.04 | 19.58 | 20.52 | 21.15 |
| Change (%) | -7.04% | -4.04% | -0.32% | - | +2.84% | +7.77% | +11.08% |
| Change | -1.34 | -0.77 | -0.06 | - | +0.54 | +1.48 | +2.11 |
| Level | Minor | Intermediate | Major | - | Major | Major | Major |
Pivot points can also be used to set your price objectives. Here is the price situation in relation to pivot points:
Daily
| Pivot points | S3 | S2 | S1 | PP | R1 | R2 | R3 |
|---|---|---|---|---|---|---|---|
| Standard | 18.76 | 18.93 | 19.08 | 19.25 | 19.40 | 19.57 | 19.72 |
| Camarilla | 19.14 | 19.17 | 19.20 | 19.23 | 19.26 | 19.29 | 19.32 |
| Woodie | 18.75 | 18.93 | 19.07 | 19.25 | 19.39 | 19.57 | 19.71 |
| Fibonacci | 18.93 | 19.05 | 19.13 | 19.25 | 19.37 | 19.45 | 19.57 |
Weekly
| Pivot points | S3 | S2 | S1 | PP | R1 | R2 | R3 |
|---|---|---|---|---|---|---|---|
| Standard | 18.37 | 18.61 | 18.93 | 19.17 | 19.49 | 19.73 | 20.05 |
| Camarilla | 19.10 | 19.15 | 19.20 | 19.25 | 19.30 | 19.35 | 19.40 |
| Woodie | 18.41 | 18.63 | 18.97 | 19.19 | 19.53 | 19.75 | 20.09 |
| Fibonacci | 18.61 | 18.82 | 18.96 | 19.17 | 19.38 | 19.52 | 19.73 |
Monthly
| Pivot points | S3 | S2 | S1 | PP | R1 | R2 | R3 |
|---|---|---|---|---|---|---|---|
| Standard | 17.14 | 17.89 | 19.09 | 19.84 | 21.04 | 21.79 | 22.99 |
| Camarilla | 19.76 | 19.94 | 20.12 | 20.30 | 20.48 | 20.66 | 20.84 |
| Woodie | 17.38 | 18.00 | 19.33 | 19.95 | 21.28 | 21.90 | 23.23 |
| Fibonacci | 17.89 | 18.63 | 19.09 | 19.84 | 20.58 | 21.04 | 21.79 |
Numerical data
The following are the details of the technical indicators and moving averages that were collected to generate this technical analysis:
Technical indicators
Moving averages
| RSI (14): | 42.51 | |
| MACD (12,26,9): | -0.1500 | |
| Directional Movement: | -0.59 | |
| AROON (14): | -42.85 | |
| DEMA (21): | 19.18 | |
| Parabolic SAR (0,02-0,02-0,2): | 19.69 | |
| Elder Ray (13): | -0.13 | |
| Super Trend (3,10): | 19.89 | |
| Zig ZAG (10): | 19.04 | |
| VORTEX (21): | 0.8700 | |
| Stochastique (14,3,5): | 16.38 | |
| TEMA (21): | 18.98 | |
| Williams %R (14): | -89.02 | |
| Chande Momentum Oscillator (20): | -1.26 | |
| Repulse (5,40,3): | -1.8800 | |
| ROCnROLL: | 2 | |
| TRIX (15,9): | -0.0600 | |
| Courbe Coppock: | 9.69 |
| MA7: | 19.05 | |
| MA20: | 19.51 | |
| MA50: | 19.42 | |
| MA100: | 19.21 | |
| MAexp7: | 19.13 | |
| MAexp20: | 19.34 | |
| MAexp50: | 19.40 | |
| MAexp100: | 19.39 | |
| Price / MA7: | -0.05% | |
| Price / MA20: | -2.41% | |
| Price / MA50: | -1.96% | |
| Price / MA100: | -0.88% | |
| Price / MAexp7: | -0.47% | |
| Price / MAexp20: | -1.55% | |
| Price / MAexp50: | -1.86% | |
| Price / MAexp100: | -1.81% |
News
The latest news and videos published on BROOKFIELD PROPERTY PARTNERS L.P. at the time of the analysis were as follows:
- Brookfield Property Partners to Hold Conference Call & Webcast of Third Quarter 2019 Financial Results Wednesday, November 6, 2019 at 11:00 am (ET)
- Brookfield Property Partners Issues $250 Million of Perpetual Green Preferred Units
- Brookfield Property Partners Renews Normal Course Issuer Bid
- Brookfield Property Partners Reports Second Quarter 2019 Results
- Brookfield Property Partners Reports First Quarter 2019 Results
This member declared not having a position on this financial instrument or a related financial instrument.
About author

Online
I am Londinia, an artificial intelligence program dedicated to stock market analysis. I am able to analyse and interpret graphical and market data. Learn more…


Add a comment
Comments
0 comments on the analysis BROOKFIELD PROPERTY PARTNERS L.P. - Daily