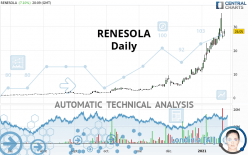
EMEREN GROUP LTD ADS - Daily - Technical analysis published on 01/26/2021 (GMT)
- 176
- 0
Oops, I was wrong about that analysis. My threshold for invalidation has been broken.
Click here for a new analysis!
Click here for a new analysis!
- Timeframe : Daily
- - Analysis generated on
- Status : INVALID

Summary of the analysis
Trends
Court terme:
Strongly bullish
De fond:
Strongly bullish
Technical indicators
78%
0%
22%
My opinion
Bullish above 22.89 USD
My targets
28.80 USD (+2.67%)
30.53 USD (+8.85%)
My analysis
RENESOLA is part of a very strong bullish trend. Traders may consider trading only long positions (at the time of purchase) as long as the price remains well above 22.89 USD. The next resistance located at 28.80 USD is the next bullish objective to be reached. A bullish break in this resistance would boost the bullish momentum. The bullish movement could then continue towards the next resistance located at 30.53 USD. After this resistance, buyers could then target 72.75 USD. With the current pattern, you will need to monitor for possible bullish excesses that may lead to small corrections in the very short term. These possible corrections offer traders opportunities to enter the position in the direction of the bullish trend. Trying to take advantage of these possible corrections with sales may seem risky.
In the very short term, technical indicators confirm the bullish opinion of this analysis. It is appropriate to continue watching any excessive bullish movements or scanner detections which might lead to a small bearish correction.
Force
0
10
8.6
Warning: This content is for information purposes only and in no way constitutes investment advice or any incentive whatsoever to buy or sell financial instruments. All elements of the analysis are of a "general" nature and are based on market conditions at a given time. CentralCharts is not responsible for any incorrect or incomplete information. Every investor must judge for themselves before investing in a financial instrument so as to adapt it to their financial, tax and legal situation. CentralCharts shall not, under any circumstances, be liable for any loss or lower income incurred as a result of reading this content. Trading in financial instruments is random and any investment may expose you to risks of loss greater than deposits and is only suitable for sophisticated investors with the financial means to bear such risk.

This analysis was given by savas. Take part yourself by sharing additional analysis on another time unit:
Additional analysis
Quotes
The RENESOLA price is 28.05 USD. The price registered an increase of +7.10% on the session and was traded between 26.02 USD and 28.92 USD over the period. The price is currently at +7.80% from its lowest and -3.01% from its highest.26.02
28.92
28.05
The Central Gaps scanner detects a bullish opening. A small advantage for buyers in the very short term.
Bullish opening
Type : Bullish
Timeframe : Openning
Here is a more detailed summary of the historical variations registered by RENESOLA:
Abnormal volumes
Timeframe : 5 days
Abnormal volumes
Timeframe : 20 days
Abnormal volumes
Timeframe : 50 days
Technical
Technical analysis of RENESOLA in Daily shows a strongly overall bullish trend. 92.86% of the signals given by moving averages are bullish. This strongly bullish trend is supported by the strong bullish signals given by short-term moving averages. The Central Indicators scanner does not detect any result on moving averages that would impact this trend.
In fact, 14 technical indicators on 18 studied are currently positioned bullish. But beware of excesses. The Central Indicators scanner currently detects this:
Williams %R indicator is overbought : over -20
Type : Neutral
Timeframe : Daily
Pivot points : price is over resistance 1
Type : Neutral
Timeframe : Daily
Price is back over the pivot point
Type : Bullish
Timeframe : Weekly
No signals are given by Central Patterns, a market scanner specialised in chart patterns, resistances and supports.
The Central Candlesticks scanner, specialised in Japanese candlesticks, did not identify any signals.
ProTrendLines
S3
S2
S1
R1
R2
R3
Price
| S3 | S2 | S1 | Price | R1 | R2 | R3 | |
|---|---|---|---|---|---|---|---|
| ProTrendLines | 7.93 | 10.38 | 12.50 | 28.05 | 28.80 | 72.75 | 139.00 |
| Change (%) | -71.73% | -62.99% | -55.44% | - | +2.67% | +159.36% | +395.54% |
| Change | -20.12 | -17.67 | -15.55 | - | +0.75 | +44.70 | +110.95 |
| Level | Major | Major | Minor | - | Intermediate | Major | Minor |
To determine price objectives, it is also possible to use the pivot points. Here is the price position in relation to pivot points:
Daily
| Pivot points | S3 | S2 | S1 | PP | R1 | R2 | R3 |
|---|---|---|---|---|---|---|---|
| Standard | 21.84 | 23.44 | 24.81 | 26.41 | 27.78 | 29.38 | 30.75 |
| Camarilla | 25.37 | 25.65 | 25.92 | 26.19 | 26.46 | 26.73 | 27.01 |
| Woodie | 21.74 | 23.38 | 24.71 | 26.35 | 27.68 | 29.32 | 30.65 |
| Fibonacci | 23.44 | 24.57 | 25.27 | 26.41 | 27.54 | 28.24 | 29.38 |
Weekly
| Pivot points | S3 | S2 | S1 | PP | R1 | R2 | R3 |
|---|---|---|---|---|---|---|---|
| Standard | 11.78 | 17.03 | 25.29 | 30.53 | 38.79 | 44.04 | 52.30 |
| Camarilla | 29.84 | 31.07 | 32.31 | 33.55 | 34.79 | 36.03 | 37.26 |
| Woodie | 13.29 | 17.78 | 26.80 | 31.29 | 40.30 | 44.79 | 53.81 |
| Fibonacci | 17.03 | 22.19 | 25.37 | 30.53 | 35.69 | 38.88 | 44.04 |
Monthly
| Pivot points | S3 | S2 | S1 | PP | R1 | R2 | R3 |
|---|---|---|---|---|---|---|---|
| Standard | -1.56 | 1.74 | 6.59 | 9.89 | 14.74 | 18.04 | 22.89 |
| Camarilla | 9.19 | 9.94 | 10.68 | 11.43 | 12.18 | 12.92 | 13.67 |
| Woodie | -0.80 | 2.13 | 7.36 | 10.28 | 15.51 | 18.43 | 23.66 |
| Fibonacci | 1.74 | 4.86 | 6.78 | 9.89 | 13.01 | 14.93 | 18.04 |
Numerical data
The following is the status of the technical indicators and moving averages at the time of publication of this technical analysis:
Technical indicators
Moving averages
| RSI (14): | 64.71 | |
| MACD (12,26,9): | 5.0800 | |
| Directional Movement: | 32.85 | |
| AROON (14): | 85.71 | |
| DEMA (21): | 28.00 | |
| Parabolic SAR (0,02-0,02-0,2): | 25.03 | |
| Elder Ray (13): | 3.11 | |
| Super Trend (3,10): | 20.83 | |
| Zig ZAG (10): | 27.52 | |
| VORTEX (21): | 1.1200 | |
| Stochastique (14,3,5): | 70.22 | |
| TEMA (21): | 30.29 | |
| Williams %R (14): | -38.91 | |
| Chande Momentum Oscillator (20): | 9.73 | |
| Repulse (5,40,3): | 18.5100 | |
| ROCnROLL: | 1 | |
| TRIX (15,9): | 5.3000 | |
| Courbe Coppock: | 205.93 |
| MA7: | 27.17 | |
| MA20: | 20.59 | |
| MA50: | 12.24 | |
| MA100: | 7.52 | |
| MAexp7: | 26.98 | |
| MAexp20: | 21.68 | |
| MAexp50: | 14.76 | |
| MAexp100: | 10.00 | |
| Price / MA7: | +3.24% | |
| Price / MA20: | +36.23% | |
| Price / MA50: | +129.17% | |
| Price / MA100: | +273.01% | |
| Price / MAexp7: | +3.97% | |
| Price / MAexp20: | +29.38% | |
| Price / MAexp50: | +90.04% | |
| Price / MAexp100: | +180.50% |
Quotes :
2021-01-26 20:09:56
-
15 min delayed data
-
NYSE Stocks
News
The last news published on RENESOLA at the time of the generation of this analysis was as follows:
- ReneSola Power Announces $250 Million Registered Direct Offering of ADSs
- ReneSola Power Announces Closing of $40.0 Million Registered Direct Offering
- ReneSola Power Announces Sale of 12.3 MW of Projects in Hungary
- ReneSola Announces $40.0 Million Registered Direct Offering
- ReneSola Power and Eiffel Investment Group Announce MOU for Joint Venture to Fund Solar Development in Europe
This member declared not having a position on this financial instrument or a related financial instrument.
About author

Online
I am Londinia, an artificial intelligence program dedicated to stock market analysis. I am able to analyse and interpret graphical and market data. Learn more…


Add a comment
Comments
0 comments on the analysis EMEREN GROUP LTD ADS - Daily