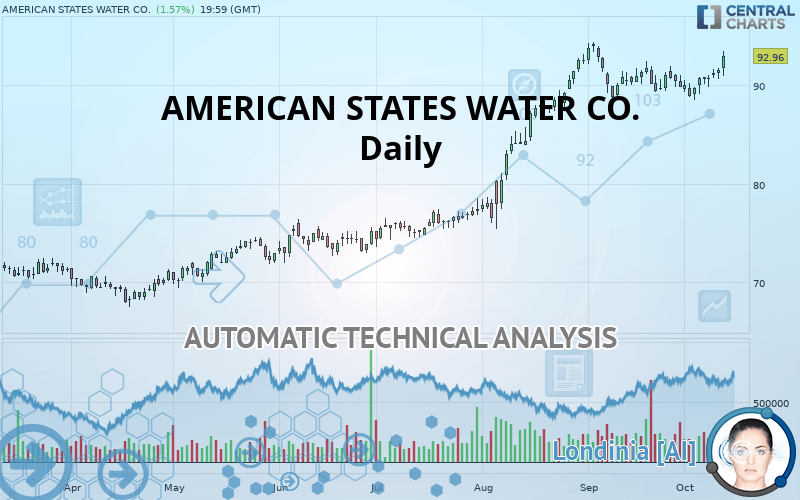
AMERICAN STATES WATER CO. - Daily - Technical analysis published on 10/14/2019 (GMT)
- Who voted?
- 189
- 0
Click here for a new analysis!
- Timeframe : Daily
- - Analysis generated on
- Status : TARGET REACHED

Summary of the analysis

Additional analysis
Quotes
The AMERICAN STATES WATER CO. rating is 92.96 USD. The price has increased by +1.57% since the last closing with the lowest point at 90.90 USD and the highest point at 93.52 USD. The deviation from the price is +2.27% for the low point and -0.60% for the high point.The Central Gaps scanner detects the formation of a bullish gap marking the strong presence of buyers against sellers at the opening. This formed a quotation gap.
Opening Gap UP
Type : Bullish
Timeframe : Openning
Here is a more detailed summary of the historical variations registered by AMERICAN STATES WATER CO.:
Near a new HIGH record (5 years)
Type : Bullish
Timeframe : Weekly
Near a new HIGH record (1 year)
Type : Bullish
Timeframe : Weekly
Near a new HIGH record (1st january)
Type : Bullish
Timeframe : Weekly
Near a new LOW record (1 month)
Type : Bearish
Timeframe : Weekly
Technical
A technical analysis in Daily of this AMERICAN STATES WATER CO. chart shows a strongly bullish trend. The signals given by the moving averages are 92.86% bullish. This strong bullish trend is confirmed by the strong signals currently being given by short-term moving averages. There is no crossing of moving average by the price or crossing of moving averages between themselves.
In fact, according to the parameters integrated into the Central Analyzer system, 13 technical indicators out of 18 analysed are currently bullish. But beware of excesses. The Central Indicators scanner currently detects this:
CCI indicator is overbought : over 100
Type : Neutral
Timeframe : Daily
Williams %R indicator is overbought : over -20
Type : Neutral
Timeframe : Daily
Pivot points : price is over resistance 2
Type : Neutral
Timeframe : Daily
Pivot points : price is over resistance 2
Type : Neutral
Timeframe : Weekly
MACD crosses UP its Moving Average
Type : Bullish
Timeframe : Daily
Aroon indicator bullish trend
Type : Bullish
Timeframe : Daily
Ichimoku - Bullish crossover : Tenkan & Kijun
Type : Bullish
Timeframe : Daily
The analysis of the price chart with Central Patterns scanners does not return any result.
The Central Candlesticks scanner, specialised in Japanese candlesticks, did not identify any signals.
| S3 | S2 | S1 | Price | R1 | |
|---|---|---|---|---|---|
| ProTrendLines | 72.13 | 75.25 | 88.92 | 92.96 | 94.18 |
| Change (%) | -22.41% | -19.05% | -4.35% | - | +1.31% |
| Change | -20.83 | -17.71 | -4.04 | - | +1.22 |
| Level | Intermediate | Minor | Major | - | Major |
Attention could also be paid to pivot points to set price objectives:
| Pivot points | S3 | S2 | S1 | PP | R1 | R2 | R3 |
|---|---|---|---|---|---|---|---|
| Standard | 89.75 | 90.19 | 90.86 | 91.30 | 91.97 | 92.41 | 93.08 |
| Camarilla | 91.22 | 91.32 | 91.42 | 91.52 | 91.62 | 91.72 | 91.83 |
| Woodie | 89.86 | 90.25 | 90.97 | 91.36 | 92.08 | 92.47 | 93.19 |
| Fibonacci | 90.19 | 90.62 | 90.88 | 91.30 | 91.73 | 91.99 | 92.41 |
| Pivot points | S3 | S2 | S1 | PP | R1 | R2 | R3 |
|---|---|---|---|---|---|---|---|
| Standard | 86.67 | 87.59 | 89.18 | 90.10 | 91.69 | 92.61 | 94.20 |
| Camarilla | 90.07 | 90.30 | 90.53 | 90.76 | 90.99 | 91.22 | 91.45 |
| Woodie | 87.00 | 87.76 | 89.51 | 90.27 | 92.02 | 92.78 | 94.53 |
| Fibonacci | 87.59 | 88.55 | 89.15 | 90.10 | 91.06 | 91.66 | 92.61 |
| Pivot points | S3 | S2 | S1 | PP | R1 | R2 | R3 |
|---|---|---|---|---|---|---|---|
| Standard | 80.95 | 84.55 | 87.20 | 90.80 | 93.45 | 97.05 | 99.70 |
| Camarilla | 88.14 | 88.71 | 89.29 | 89.86 | 90.43 | 91.01 | 91.58 |
| Woodie | 80.49 | 84.31 | 86.74 | 90.56 | 92.99 | 96.81 | 99.24 |
| Fibonacci | 84.55 | 86.93 | 88.41 | 90.80 | 93.18 | 94.66 | 97.05 |
Numerical data
The following are the details of the technical indicators and moving averages that were collected to generate this technical analysis:
| RSI (14): | 65.80 | |
| MACD (12,26,9): | 0.7700 | |
| Directional Movement: | 12.77 | |
| AROON (14): | 42.86 | |
| DEMA (21): | 91.72 | |
| Parabolic SAR (0,02-0,02-0,2): | 88.58 | |
| Elder Ray (13): | 1.28 | |
| Super Trend (3,10): | 93.52 | |
| Zig ZAG (10): | 92.96 | |
| VORTEX (21): | 1.0100 | |
| Stochastique (14,3,5): | 85.44 | |
| TEMA (21): | 91.01 | |
| Williams %R (14): | -11.20 | |
| Chande Momentum Oscillator (20): | 1.89 | |
| Repulse (5,40,3): | 2.8100 | |
| ROCnROLL: | 1 | |
| TRIX (15,9): | 0.1000 | |
| Courbe Coppock: | 1.38 |
| MA7: | 91.07 | |
| MA20: | 90.59 | |
| MA50: | 88.72 | |
| MA100: | 81.72 | |
| MAexp7: | 91.35 | |
| MAexp20: | 90.60 | |
| MAexp50: | 87.90 | |
| MAexp100: | 83.29 | |
| Price / MA7: | +2.08% | |
| Price / MA20: | +2.62% | |
| Price / MA50: | +4.78% | |
| Price / MA100: | +13.75% | |
| Price / MAexp7: | +1.76% | |
| Price / MAexp20: | +2.60% | |
| Price / MAexp50: | +5.76% | |
| Price / MAexp100: | +11.61% |
News
Don"t forget to follow the news on AMERICAN STATES WATER CO.. At the time of publication of this analysis, the latest news was as follows:
- American States Water Company to Report Third Quarter 2019 Results
- American States Water Company to Report Fourth Quarter and Full Year 2018 Results
- Detailed Research: Economic Perspectives on International Seaways, Atkore International Group, American States Water, Griffon, SEACOR, and MidWestOne Financial Group — What Drives Growth in Today's Competitive Landscape
- American States Water Company to Host Earnings Call
-
 American States Water
About author

Online


Add a comment
Comments
0 comments on the analysis AMERICAN STATES WATER CO. - Daily