BCE INC. - Daily - Technical analysis published on 10/25/2019 (GMT)
- Who voted?
- 171
- 0
Click here for a new analysis!
- Timeframe : Daily
- - Analysis generated on
- Status : INVALID

Summary of the analysis

Additional analysis
Quotes
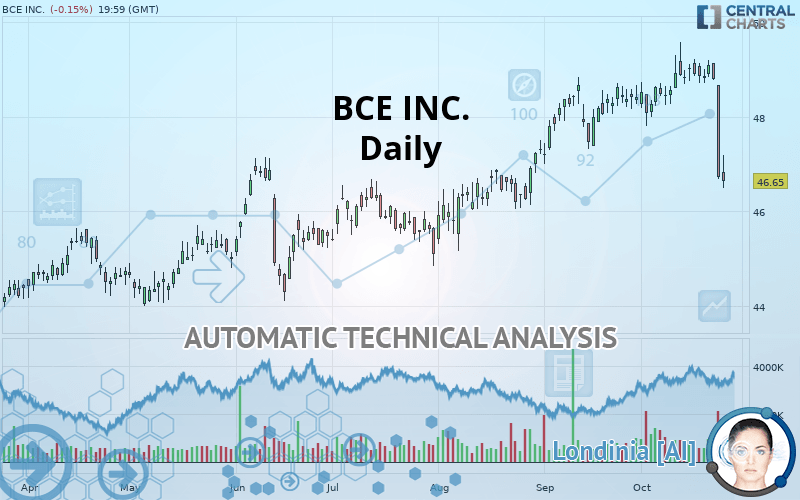
BCE INC. rating 46.65 USD. The price is lower by -0.15% since the last closing and was between 46.50 USD and 47.20 USD. This implies that the price is at +0.32% from its lowest and at -1.17% from its highest.The Central Gaps scanner detects a bullish opening marking the presence of buyers ahead of sellers at the opening but not sufficiently marked to allow the price to register a quotation gap.
Bullish opening
Type : Bullish
Timeframe : Openning
So that you have an overall view of the price change, here is a table showing the variations over several periods:
Near a new HIGH record (5 years)
Type : Bullish
Timeframe : Weekly
Technical
Technical analysis of BCE INC. in Daily shows an overall slightly bullish trend. 57.14% of the signals given by moving averages are bullish. Caution: the strong bearish signals currently being given by short-term moving averages indicate that this slightly bullish trend could be reversed. The Central Indicators scanner detects bearish signals on moving averages that could impact this trend:
Bearish trend reversal : Moving Average 20
Type : Bearish
Timeframe : Daily
Bearish trend reversal : adaptative moving average 20
Type : Bearish
Timeframe : Daily
Bearish trend reversal : adaptative moving average 50
Type : Bearish
Timeframe : Daily
Bearish price crossover with Moving Average 20
Type : Bearish
Timeframe : Daily
Bearish price crossover with Moving Average 50
Type : Bearish
Timeframe : Daily
Bearish price crossover with adaptative moving average 20
Type : Bearish
Timeframe : Daily
Bearish price crossover with adaptative moving average 50
Type : Bearish
Timeframe : Daily
Bearish price crossover with adaptative moving average 100
Type : Bearish
Timeframe : Daily
In fact, according to the parameters integrated into the Central Analyzer system, 13 technical indicators out of 18 analysed are currently bearish. But beware of excesses. The Central Indicators scanner currently detects this:
CCI indicator is oversold : under -100
Type : Neutral
Timeframe : Daily
Williams %R indicator is oversold : under -80
Type : Neutral
Timeframe : Daily
Pivot points : price is under support 3
Type : Neutral
Timeframe : Weekly
RSI indicator is back under 50
Type : Bearish
Timeframe : Daily
SuperTrend indicator bearish reversal
Type : Bearish
Timeframe : Daily
Price is back under the pivot point
Type : Bearish
Timeframe : Daily
Momentum indicator is back under 0
Type : Bearish
Timeframe : Daily
Williams %R indicator is back under -50
Type : Bearish
Timeframe : Daily
An analysis of the price chart with the Central Patterns scanner (detector of chart patterns and resistances and supports) shows several results that can have an impact on the price change:
Horizontal support is broken
Type : Bearish
Timeframe : Daily
Support of channel is broken
Type : Bearish
Timeframe : Daily
Central Candlesticks, the scanner specialised in Japanese candlesticks, detects these bearish signals that could support the hypothesis of a small drop in the very short term:
Black line without upper shadow
Type : Bearish
Timeframe : Daily
Black marubozu
Type : Bearish
Timeframe : Daily
Downside gap
Type : Bearish
Timeframe : Daily
Long black line
Type : Bearish
Timeframe : Daily
| S3 | S2 | S1 | Price | R1 | R2 | R3 | |
|---|---|---|---|---|---|---|---|
| ProTrendLines | 42.85 | 44.30 | 45.09 | 46.65 | 46.88 | 47.47 | 48.07 |
| Change (%) | -8.15% | -5.04% | -3.34% | - | +0.49% | +1.76% | +3.04% |
| Change | -3.80 | -2.35 | -1.56 | - | +0.23 | +0.82 | +1.42 |
| Level | Minor | Intermediate | Intermediate | - | Intermediate | Minor | Major |
Attention could also be paid to pivot points to set price objectives:
| Pivot points | S3 | S2 | S1 | PP | R1 | R2 | R3 |
|---|---|---|---|---|---|---|---|
| Standard | 44.05 | 45.37 | 46.04 | 47.36 | 48.03 | 49.35 | 50.02 |
| Camarilla | 46.17 | 46.36 | 46.54 | 46.72 | 46.90 | 47.09 | 47.27 |
| Woodie | 43.74 | 45.21 | 45.73 | 47.20 | 47.72 | 49.19 | 49.71 |
| Fibonacci | 45.37 | 46.13 | 46.60 | 47.36 | 48.12 | 48.59 | 49.35 |
| Pivot points | S3 | S2 | S1 | PP | R1 | R2 | R3 |
|---|---|---|---|---|---|---|---|
| Standard | 48.12 | 48.41 | 48.64 | 48.93 | 49.16 | 49.45 | 49.68 |
| Camarilla | 48.73 | 48.78 | 48.82 | 48.87 | 48.92 | 48.97 | 49.01 |
| Woodie | 48.09 | 48.40 | 48.61 | 48.92 | 49.13 | 49.44 | 49.65 |
| Fibonacci | 48.41 | 48.61 | 48.73 | 48.93 | 49.13 | 49.25 | 49.45 |
| Pivot points | S3 | S2 | S1 | PP | R1 | R2 | R3 |
|---|---|---|---|---|---|---|---|
| Standard | 44.69 | 45.56 | 46.98 | 47.85 | 49.27 | 50.14 | 51.56 |
| Camarilla | 47.78 | 47.99 | 48.20 | 48.41 | 48.62 | 48.83 | 49.04 |
| Woodie | 44.98 | 45.70 | 47.27 | 47.99 | 49.56 | 50.28 | 51.84 |
| Fibonacci | 45.56 | 46.43 | 46.97 | 47.85 | 48.72 | 49.26 | 50.14 |
Numerical data
The following are the details of the technical indicators and moving averages that were collected to generate this technical analysis:
| RSI (14): | 30.13 | |
| MACD (12,26,9): | 0.0100 | |
| Directional Movement: | -18.70 | |
| AROON (14): | -64.29 | |
| DEMA (21): | 48.41 | |
| Parabolic SAR (0,02-0,02-0,2): | 49.41 | |
| Elder Ray (13): | -1.36 | |
| Super Trend (3,10): | 48.64 | |
| Zig ZAG (10): | 46.65 | |
| VORTEX (21): | 0.8400 | |
| Stochastique (14,3,5): | 19.06 | |
| TEMA (21): | 48.00 | |
| Williams %R (14): | -95.13 | |
| Chande Momentum Oscillator (20): | -1.80 | |
| Repulse (5,40,3): | -4.8800 | |
| ROCnROLL: | 2 | |
| TRIX (15,9): | 0.0900 | |
| Courbe Coppock: | 1.14 |
| MA7: | 48.27 | |
| MA20: | 48.47 | |
| MA50: | 47.68 | |
| MA100: | 46.47 | |
| MAexp7: | 47.91 | |
| MAexp20: | 48.25 | |
| MAexp50: | 47.68 | |
| MAexp100: | 46.60 | |
| Price / MA7: | -3.36% | |
| Price / MA20: | -3.75% | |
| Price / MA50: | -2.16% | |
| Price / MA100: | +0.39% | |
| Price / MAexp7: | -2.63% | |
| Price / MAexp20: | -3.32% | |
| Price / MAexp50: | -2.16% | |
| Price / MAexp100: | +0.11% |
About author

Online


Add a comment
Comments
0 comments on the analysis BCE INC. - Daily