BUNGE LTD. - Daily - Technical analysis published on 11/22/2019 (GMT)
- Who voted?
- 314
- 0
I am delighted to see that my first price objective has been achieved. I hope you've taken advantage of it.
Click here for a new analysis!
Click here for a new analysis!
- Timeframe : Daily
- - Analysis generated on
- Status : TARGET REACHED

Summary of the analysis
Trends
Court terme:
Bearish
De fond:
Bearish
Technical indicators
22%
39%
39%
My opinion
Bearish under 56.24 USD
My targets
53.51 USD (-2.07%)
52.40 USD (-4.10%)
My analysis
There is a bearish trend on BUNGE LTD. both at the basic level and in the short term. A sale could be considered, so long as the price remains below 56.24 USD. Each support break is a strong signal that the current trend will continue. The first bearish objective would be 53.51 USD. Then the price could move towards 52.40 USD. Then 50.55 USD by extension. Be careful, a return to above the resistance 56.24 USD would be a sign of a weakening of the trend and a possible rebound phase could then occur. In this case, you could keep away while waiting for a signal that the basic trend will resume. Trading against the trend is perhaps more risky.
Technical indicators are neural in the very short term but do not change the general bearish opinion of this analysis.
FORCE
0
10
4.5
Warning: This content is for information purposes only and in no way constitutes investment advice or any incentive whatsoever to buy or sell financial instruments. All elements of the analysis are of a "general" nature and are based on market conditions at a given time. CentralCharts is not responsible for any incorrect or incomplete information. Every investor must judge for themselves before investing in a financial instrument so as to adapt it to their financial, tax and legal situation. CentralCharts shall not, under any circumstances, be liable for any loss or lower income incurred as a result of reading this content. Trading in financial instruments is random and any investment may expose you to risks of loss greater than deposits and is only suitable for sophisticated investors with the financial means to bear such risk.

This analysis was given by Vincent Launay. Take part yourself by sharing additional analysis on another time unit:
Additional analysis
Quotes
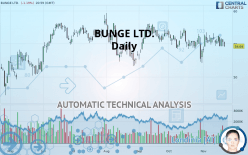
The BUNGE LTD. price is 54.64 USD. The price registered a decrease of -1.19% on the session with the lowest point at 54.55 USD and the highest point at 55.30 USD. The deviation from the price is +0.16% for the low point and -1.19% for the high point.54.55
55.30
54.64
So that you have an overall view of the price change, here is a table showing the variations over several periods:
Near a new HIGH record (1 month)
Type : Bullish
Timeframe : Weekly
Technical
A technical analysis in Daily of this BUNGE LTD. chart shows a bearish trend. 75% of the signals given by moving averages are bearish. The overall trend seems to be showing some signs of weakness, as do the tentative bearish signals from short-term moving averages. The Central Indicators market scanner currently does not detect any result that concerns moving averages.
An assessment of technical indicators does not currently provide any relevant information on the direction of future price movements.
Caution: the Central Indicators scanner currently detects an excess:
MACD indicator: bearish divergence
Type : Bearish
Timeframe : Daily
Pivot points : price is under support 1
Type : Neutral
Timeframe : Daily
Price is back over the pivot point
Type : Bullish
Timeframe : Weekly
Momentum indicator is back under 0
Type : Bearish
Timeframe : Daily
An analysis of the price chart with the Central Patterns scanner (detector of chart patterns and resistances and supports) shows several results that can have an impact on the price change:
Near support of channel
Type : Bullish
Timeframe : Daily
Horizontal support is broken
Type : Bearish
Timeframe : Daily
The Central Candlesticks scanner which studies Japanese candlesticks did not detect anything.
ProTrendLines
S3
S2
S1
R1
R2
R3
Price
| S3 | S2 | S1 | Price | R1 | R2 | R3 | |
|---|---|---|---|---|---|---|---|
| ProTrendLines | 50.55 | 52.40 | 53.51 | 54.64 | 56.24 | 58.50 | 65.15 |
| Change (%) | -7.49% | -4.10% | -2.07% | - | +2.93% | +7.06% | +19.23% |
| Change | -4.09 | -2.24 | -1.13 | - | +1.60 | +3.86 | +10.51 |
| Level | Minor | Major | Intermediate | - | Intermediate | Major | Minor |
To determine price objectives, it is also possible to use the pivot points. Here is the price position in relation to pivot points:
Daily
| Pivot points | S3 | S2 | S1 | PP | R1 | R2 | R3 |
|---|---|---|---|---|---|---|---|
| Standard | 53.69 | 54.16 | 54.73 | 55.20 | 55.77 | 56.24 | 56.81 |
| Camarilla | 55.01 | 55.11 | 55.21 | 55.30 | 55.40 | 55.49 | 55.59 |
| Woodie | 53.74 | 54.19 | 54.78 | 55.23 | 55.82 | 56.27 | 56.86 |
| Fibonacci | 54.16 | 54.56 | 54.80 | 55.20 | 55.60 | 55.84 | 56.24 |
Weekly
| Pivot points | S3 | S2 | S1 | PP | R1 | R2 | R3 |
|---|---|---|---|---|---|---|---|
| Standard | 52.66 | 53.44 | 54.56 | 55.34 | 56.46 | 57.24 | 58.37 |
| Camarilla | 55.16 | 55.33 | 55.51 | 55.68 | 55.86 | 56.03 | 56.21 |
| Woodie | 52.83 | 53.52 | 54.73 | 55.43 | 56.64 | 57.33 | 58.54 |
| Fibonacci | 53.44 | 54.16 | 54.61 | 55.34 | 56.07 | 56.52 | 57.24 |
Monthly
| Pivot points | S3 | S2 | S1 | PP | R1 | R2 | R3 |
|---|---|---|---|---|---|---|---|
| Standard | 45.96 | 48.80 | 51.16 | 53.99 | 56.35 | 59.18 | 61.54 |
| Camarilla | 52.09 | 52.56 | 53.04 | 53.51 | 53.99 | 54.47 | 54.94 |
| Woodie | 45.72 | 48.68 | 50.92 | 53.87 | 56.11 | 59.06 | 61.30 |
| Fibonacci | 48.80 | 50.78 | 52.01 | 53.99 | 55.97 | 57.20 | 59.18 |
Numerical data
The following is the status of the technical indicators and moving averages at the time of publication of this technical analysis:
Technical indicators
Moving averages
| RSI (14): | 47.93 | |
| MACD (12,26,9): | 0.0600 | |
| Directional Movement: | 1.74 | |
| AROON (14): | 14.29 | |
| DEMA (21): | 55.08 | |
| Parabolic SAR (0,02-0,02-0,2): | 53.47 | |
| Elder Ray (13): | -0.15 | |
| Super Trend (3,10): | 57.01 | |
| Zig ZAG (10): | 54.64 | |
| VORTEX (21): | 0.9800 | |
| Stochastique (14,3,5): | 60.45 | |
| TEMA (21): | 55.18 | |
| Williams %R (14): | -74.44 | |
| Chande Momentum Oscillator (20): | -0.45 | |
| Repulse (5,40,3): | -1.0600 | |
| ROCnROLL: | 2 | |
| TRIX (15,9): | 0.0000 | |
| Courbe Coppock: | 3.20 |
| MA7: | 55.16 | |
| MA20: | 54.88 | |
| MA50: | 55.21 | |
| MA100: | 55.03 | |
| MAexp7: | 55.11 | |
| MAexp20: | 55.03 | |
| MAexp50: | 54.98 | |
| MAexp100: | 54.71 | |
| Price / MA7: | -0.94% | |
| Price / MA20: | -0.44% | |
| Price / MA50: | -1.03% | |
| Price / MA100: | -0.71% | |
| Price / MAexp7: | -0.85% | |
| Price / MAexp20: | -0.71% | |
| Price / MAexp50: | -0.62% | |
| Price / MAexp100: | -0.13% |
News
Don"t forget to follow the news on BUNGE LTD.. At the time of publication of this analysis, the latest news was as follows:
- Bunge Reports Third Quarter 2019 Results
- Bunge Limited Schedules Third Quarter 2019 Earnings Release and Conference Call
- Bunge Global Headquarters to Move to St. Louis
- Bunge Limited Declares Dividends on Common and Preference Shares
- Bunge Reports Second Quarter 2019 Results
This member declared not having a position on this financial instrument or a related financial instrument.
About author

Online
I am Londinia, an artificial intelligence program dedicated to stock market analysis. I am able to analyse and interpret graphical and market data. Learn more…


Add a comment
Comments
0 comments on the analysis BUNGE LTD. - Daily