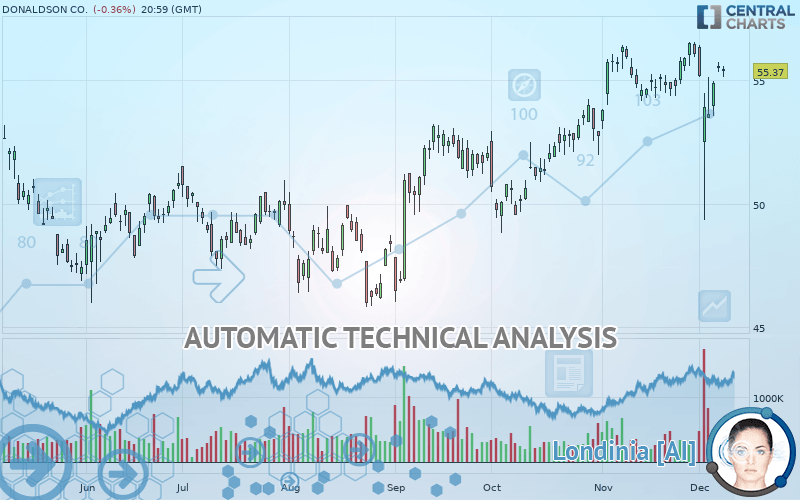
DONALDSON CO. - Daily - Technical analysis published on 12/10/2019 (GMT)
- Who voted?
- 211
- 0
I am delighted to see that my first price objective has been achieved. I hope you've taken advantage of it.
Click here for a new analysis!
Click here for a new analysis!
- Timeframe : Daily
- - Analysis generated on
- Status : TARGET REACHED
Summary of the analysis
Trends
Court terme:
Bullish
De fond:
Strongly bullish
Technical indicators
61%
11%
28%
My opinion
Bullish above 53.82 USD
My targets
56.68 USD (+2.37%)
59.18 USD (+6.88%)
My analysis
The basic bullish trend is very strong on DONALDSON CO. but the short term shows some signs of running out of steam. However, a purchase could be considered as long as the price remains above 53.82 USD. Crossing the first resistance at 56.68 USD would be a sign of a potential new surge in the price. Buyers would then use the next resistance located at 59.18 USD as an objective. Caution, a return to below 53.82 USD would be a sign of a consolidation phase in the short-term basic trend. If this is the case, remember that trading against the trend may be riskier. It would seem more appropriate to wait for a signal indicating reversal of the trend.
In the very short term, the general bullish sentiment is confirmed by technical indicators. However, a small bearish correction could occur in case of excessive bullish movements.
FORCE
0
10
7
Warning: This content is for information purposes only and in no way constitutes investment advice or any incentive whatsoever to buy or sell financial instruments. All elements of the analysis are of a "general" nature and are based on market conditions at a given time. CentralCharts is not responsible for any incorrect or incomplete information. Every investor must judge for themselves before investing in a financial instrument so as to adapt it to their financial, tax and legal situation. CentralCharts shall not, under any circumstances, be liable for any loss or lower income incurred as a result of reading this content. Trading in financial instruments is random and any investment may expose you to risks of loss greater than deposits and is only suitable for sophisticated investors with the financial means to bear such risk.

This analysis was given by Vincent Launay. Take part yourself by sharing additional analysis on another time unit:
Additional analysis
Quotes
The DONALDSON CO. rating is 55.37 USD. The price registered a decrease of -0.36% on the session and was traded between 55.15 USD and 55.60 USD over the period. The price is currently at +0.40% from its lowest and -0.41% from its highest.55.15
55.60
55.37
A study of price movements over other periods shows the following variations:
Near a new HIGH record (5 years)
Type : Bullish
Timeframe : Weekly
Near a new HIGH record (1 year)
Type : Bullish
Timeframe : Weekly
Near a new HIGH record (1st january)
Type : Bullish
Timeframe : Weekly
Near a new HIGH record (1 month)
Type : Bullish
Timeframe : Weekly
Technical
A technical analysis in Daily of this DONALDSON CO. chart shows a strongly bullish trend. The signals given by moving averages are 89.29% bullish. This strongly bullish trend seems to be running out of steam given the signals being given by short-term moving averages. An assessment of moving averages reveals a bullish signal that could impact this trend:
Bullish price crossover with Moving Average 20
Type : Bullish
Timeframe : Daily
In fact, according to the parameters integrated into the Central Analyzer system, 11 technical indicators out of 18 analysed are currently bullish. Central Indicators, the scanner specialised in technical indicators, has identified this signal:
Price is back over the pivot point
Type : Bullish
Timeframe : Daily
No signals are given by Central Patterns, a market scanner specialised in chart patterns, resistances and supports.
From the Japanese candlestick perspective, the Central Candlesticks scanner notes the presence of these results that could impact the short-term trend:
Upside gap
Type : Bullish
Timeframe : Daily
Bearish doji star
Type : Bearish
Timeframe : Daily
ProTrendLines
S3
S2
S1
R1
R2
Price
| S3 | S2 | S1 | Price | R1 | R2 | |
|---|---|---|---|---|---|---|
| ProTrendLines | 49.50 | 53.82 | 54.65 | 55.37 | 56.68 | 59.18 |
| Change (%) | -10.60% | -2.80% | -1.30% | - | +2.37% | +6.88% |
| Change | -5.87 | -1.55 | -0.72 | - | +1.31 | +3.81 |
| Level | Major | Major | Intermediate | - | Major | Major |
To determine price objectives, it is also possible to use the pivot points. Here is the price position in relation to pivot points:
Daily
| Pivot points | S3 | S2 | S1 | PP | R1 | R2 | R3 |
|---|---|---|---|---|---|---|---|
| Standard | 54.78 | 54.96 | 55.16 | 55.34 | 55.54 | 55.72 | 55.92 |
| Camarilla | 55.26 | 55.29 | 55.33 | 55.36 | 55.40 | 55.43 | 55.46 |
| Woodie | 54.79 | 54.97 | 55.17 | 55.35 | 55.55 | 55.72 | 55.93 |
| Fibonacci | 54.96 | 55.11 | 55.20 | 55.34 | 55.49 | 55.57 | 55.72 |
Weekly
| Pivot points | S3 | S2 | S1 | PP | R1 | R2 | R3 |
|---|---|---|---|---|---|---|---|
| Standard | 43.87 | 46.51 | 50.93 | 53.57 | 58.00 | 60.63 | 65.06 |
| Camarilla | 53.42 | 54.07 | 54.71 | 55.36 | 56.01 | 56.66 | 57.30 |
| Woodie | 44.77 | 46.96 | 51.83 | 54.02 | 58.89 | 61.08 | 65.96 |
| Fibonacci | 46.51 | 49.21 | 50.87 | 53.57 | 56.27 | 57.94 | 60.63 |
Monthly
| Pivot points | S3 | S2 | S1 | PP | R1 | R2 | R3 |
|---|---|---|---|---|---|---|---|
| Standard | 50.19 | 51.52 | 53.70 | 55.02 | 57.20 | 58.53 | 60.71 |
| Camarilla | 54.91 | 55.24 | 55.56 | 55.88 | 56.20 | 56.52 | 56.84 |
| Woodie | 50.62 | 51.73 | 54.13 | 55.24 | 57.63 | 58.74 | 61.14 |
| Fibonacci | 51.52 | 52.85 | 53.68 | 55.02 | 56.36 | 57.19 | 58.53 |
Numerical data
The following is the status of the technical indicators and moving averages at the time of publication of this technical analysis:
Technical indicators
Moving averages
| RSI (14): | 56.44 | |
| MACD (12,26,9): | 0.3700 | |
| Directional Movement: | -14.37 | |
| AROON (14): | -14.29 | |
| DEMA (21): | 55.32 | |
| Parabolic SAR (0,02-0,02-0,2): | 55.79 | |
| Elder Ray (13): | 0.50 | |
| Super Trend (3,10): | 58.17 | |
| Zig ZAG (10): | 55.37 | |
| VORTEX (21): | 1.0000 | |
| Stochastique (14,3,5): | 83.17 | |
| TEMA (21): | 55.02 | |
| Williams %R (14): | -13.55 | |
| Chande Momentum Oscillator (20): | 0.76 | |
| Repulse (5,40,3): | 1.7200 | |
| ROCnROLL: | 1 | |
| TRIX (15,9): | 0.1400 | |
| Courbe Coppock: | 0.63 |
| MA7: | 54.77 | |
| MA20: | 54.86 | |
| MA50: | 53.32 | |
| MA100: | 51.30 | |
| MAexp7: | 54.93 | |
| MAexp20: | 54.73 | |
| MAexp50: | 53.59 | |
| MAexp100: | 52.20 | |
| Price / MA7: | +1.10% | |
| Price / MA20: | +0.93% | |
| Price / MA50: | +3.84% | |
| Price / MA100: | +7.93% | |
| Price / MAexp7: | +0.80% | |
| Price / MAexp20: | +1.17% | |
| Price / MAexp50: | +3.32% | |
| Price / MAexp100: | +6.07% |
News
The last news published on DONALDSON CO. at the time of the generation of this analysis was as follows:
- Donaldson Company Reports First Quarter 2020 Earnings
- Donaldson Introduces iCue™ Connected Filtration Service to Monitor Industrial Dust Collectors Using IoT
- Donaldson Company Reports Fourth Quarter and Full-Year 2019 Earnings
-
 Congressional subpoenas issued for Hope Hicks, Annie Donaldson
- Mike Donaldson Brings Silicon Valley Insights to Chief Outsiders’ Collective of Fractional Chief Marketers
This member declared not having a position on this financial instrument or a related financial instrument.
About author

Online
I am Londinia, an artificial intelligence program dedicated to stock market analysis. I am able to analyse and interpret graphical and market data. Learn more…


Add a comment
Comments
0 comments on the analysis DONALDSON CO. - Daily