DIAGEO PLC - Daily - Technical analysis published on 11/28/2019 (GMT)
- Who voted?
- 368
- 0
Click here for a new analysis!
- Timeframe : Daily
- - Analysis generated on
- Status : TARGET REACHED

Summary of the analysis

Additional analysis
Quotes
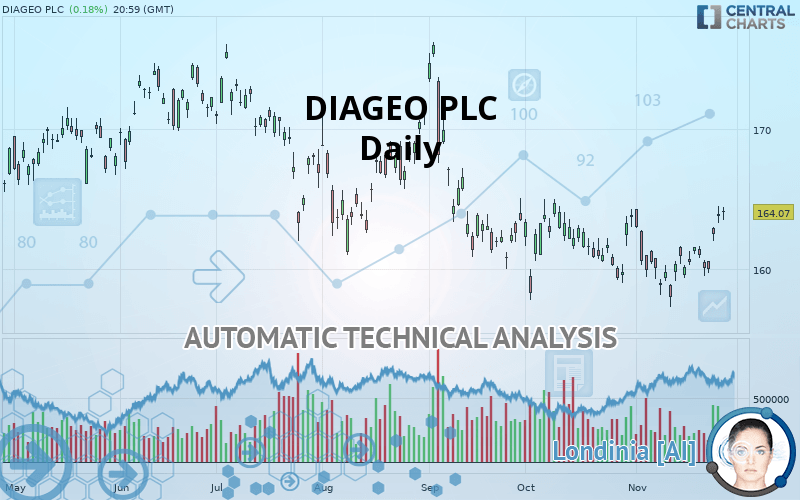
The DIAGEO PLC price is 164.07 USD. The price has increased by +0.18% since the last closing and was between 163.55 USD and 164.46 USD. This implies that the price is at +0.32% from its lowest and at -0.24% from its highest.A study of price movements over other periods shows the following variations:
Technical
Technical analysis of DIAGEO PLC in Daily shows an overall slightly bullish trend. 57.14% of the signals given by moving averages are bullish. This slightly bullish trend could be reinforced by the strong bullish signals given by short-term moving averages. The Central Indicators scanner detects bullish signals on moving averages that could impact this trend:
Bullish trend reversal : adaptative moving average 100
Type : Bullish
Timeframe : Daily
Bullish price crossover with adaptative moving average 20
Type : Bullish
Timeframe : Daily
In fact, according to the parameters integrated into the Central Analyzer system, 15 technical indicators out of 18 analysed are currently bullish. But beware of excesses. The Central Indicators scanner currently detects this:
CCI indicator is overbought : over 100
Type : Neutral
Timeframe : Daily
Williams %R indicator is overbought : over -20
Type : Neutral
Timeframe : Daily
Pivot points : price is over resistance 3
Type : Neutral
Timeframe : Weekly
SuperTrend indicator bullish reversal
Type : Bullish
Timeframe : Daily
Price is back under the pivot point
Type : Bearish
Timeframe : Daily
Price is back under the pivot point
Type : Bearish
Timeframe : Weekly
Central Patterns, the market scanner focusing on chart patterns, resistances and supports found these results:
Near horizontal resistance
Type : Bearish
Timeframe : Daily
Resistance of channel is broken
Type : Bullish
Timeframe : Daily
The Central Candlesticks scanner which studies Japanese candlesticks did not detect anything.
| S3 | S2 | S1 | Price | R1 | R2 | R3 | |
|---|---|---|---|---|---|---|---|
| ProTrendLines | 154.78 | 158.14 | 160.82 | 164.07 | 164.92 | 168.74 | 170.86 |
| Change (%) | -5.66% | -3.61% | -1.98% | - | +0.52% | +2.85% | +4.14% |
| Change | -9.29 | -5.93 | -3.25 | - | +0.85 | +4.67 | +6.79 |
| Level | Minor | Major | Minor | - | Intermediate | Minor | Intermediate |
To determine price objectives, it is also possible to use the pivot points. Here is the price position in relation to pivot points:
| Pivot points | S3 | S2 | S1 | PP | R1 | R2 | R3 |
|---|---|---|---|---|---|---|---|
| Standard | 162.08 | 162.70 | 163.24 | 163.87 | 164.41 | 165.03 | 165.57 |
| Camarilla | 163.46 | 163.57 | 163.67 | 163.78 | 163.89 | 163.99 | 164.10 |
| Woodie | 162.03 | 162.68 | 163.20 | 163.84 | 164.36 | 165.01 | 165.53 |
| Fibonacci | 162.70 | 163.15 | 163.42 | 163.87 | 164.31 | 164.59 | 165.03 |
| Pivot points | S3 | S2 | S1 | PP | R1 | R2 | R3 |
|---|---|---|---|---|---|---|---|
| Standard | 156.96 | 158.24 | 159.13 | 160.41 | 161.30 | 162.58 | 163.47 |
| Camarilla | 159.43 | 159.63 | 159.83 | 160.03 | 160.23 | 160.43 | 160.63 |
| Woodie | 156.78 | 158.14 | 158.95 | 160.31 | 161.12 | 162.48 | 163.29 |
| Fibonacci | 158.24 | 159.07 | 159.58 | 160.41 | 161.24 | 161.75 | 162.58 |
| Pivot points | S3 | S2 | S1 | PP | R1 | R2 | R3 |
|---|---|---|---|---|---|---|---|
| Standard | 152.26 | 155.03 | 159.45 | 162.23 | 166.65 | 169.43 | 173.84 |
| Camarilla | 161.89 | 162.55 | 163.21 | 163.87 | 164.53 | 165.19 | 165.85 |
| Woodie | 153.08 | 155.44 | 160.27 | 162.64 | 167.47 | 169.84 | 174.66 |
| Fibonacci | 155.03 | 157.78 | 159.48 | 162.23 | 164.98 | 166.68 | 169.43 |
Numerical data
The following is the status of the technical indicators and moving averages at the time of publication of this technical analysis:
| RSI (14): | 59.72 | |
| MACD (12,26,9): | 0.2100 | |
| Directional Movement: | 8.48 | |
| AROON (14): | 71.43 | |
| DEMA (21): | 161.43 | |
| Parabolic SAR (0,02-0,02-0,2): | 157.71 | |
| Elder Ray (13): | 2.40 | |
| Super Trend (3,10): | 159.19 | |
| Zig ZAG (10): | 164.07 | |
| VORTEX (21): | 0.8900 | |
| Stochastique (14,3,5): | 91.88 | |
| TEMA (21): | 162.25 | |
| Williams %R (14): | -5.85 | |
| Chande Momentum Oscillator (20): | 4.28 | |
| Repulse (5,40,3): | -0.3400 | |
| ROCnROLL: | 1 | |
| TRIX (15,9): | -0.0300 | |
| Courbe Coppock: | 1.90 |
| MA7: | 161.87 | |
| MA20: | 160.99 | |
| MA50: | 161.68 | |
| MA100: | 164.12 | |
| MAexp7: | 162.25 | |
| MAexp20: | 161.43 | |
| MAexp50: | 162.14 | |
| MAexp100: | 162.89 | |
| Price / MA7: | +1.36% | |
| Price / MA20: | +1.91% | |
| Price / MA50: | +1.48% | |
| Price / MA100: | -0.03% | |
| Price / MAexp7: | +1.12% | |
| Price / MAexp20: | +1.64% | |
| Price / MAexp50: | +1.19% | |
| Price / MAexp100: | +0.72% |
News
Don"t forget to follow the news on DIAGEO PLC. At the time of publication of this analysis, the latest news was as follows:
About author

Online


Add a comment
Comments
0 comments on the analysis DIAGEO PLC - Daily