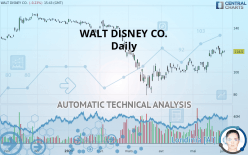
WALT DISNEY CO. - Daily - Technical analysis published on 06/02/2020 (GMT)
- Who voted?
- 281
- 0
I am delighted to see that my first price objective has been achieved. I hope you've taken advantage of it.
Click here for a new analysis!
Click here for a new analysis!
- Timeframe : Daily
- - Analysis generated on
- Status : TARGET REACHED

Summary of the analysis
Trends
Court terme:
Strongly bullish
De fond:
Bullish
Technical indicators
67%
6%
28%
My opinion
Bullish above 115.72 USD
My targets
121.69 USD (+2.69%)
128.15 USD (+8.14%)
My analysis
All elements being clearly bullish, it would be possible for traders to trade only long positions (at the time of purchase) on WALT DISNEY CO. as long as the price remains well above 115.72 USD. The buyers” bullish objective is set at 121.69 USD. A bullish break in this resistance would boost the bullish momentum. The buyers could then target the resistance located at 128.15 USD. If there is any crossing, the next objective would be the resistance located at 139.74 USD.
In the very short term, the general bullish sentiment is confirmed by technical indicators. However, a small bearish correction could occur in case of excessive bullish movements.
FORCE
0
10
5.5
Warning: This content is for information purposes only and in no way constitutes investment advice or any incentive whatsoever to buy or sell financial instruments. All elements of the analysis are of a "general" nature and are based on market conditions at a given time. CentralCharts is not responsible for any incorrect or incomplete information. Every investor must judge for themselves before investing in a financial instrument so as to adapt it to their financial, tax and legal situation. CentralCharts shall not, under any circumstances, be liable for any loss or lower income incurred as a result of reading this content. Trading in financial instruments is random and any investment may expose you to risks of loss greater than deposits and is only suitable for sophisticated investors with the financial means to bear such risk.

This analysis was given by Vincent Launay. Take part yourself by sharing additional analysis on another time unit:
Additional analysis
Quotes
WALT DISNEY CO. rating 118.50 USD. The price is lower by -0.23% since the last closing and was between 117.83 USD and 119.85 USD. This implies that the price is at +0.57% from its lowest and at -1.13% from its highest.117.83
119.85
118.50
A bullish opening was detected by the Central Gaps scanner. Buyers are trying to impose a bullish momentum in the very short term.
Bullish opening
Type : Bullish
Timeframe : Openning
Here is a more detailed summary of the historical variations registered by WALT DISNEY CO.:
Near a new HIGH record (1 month)
Type : Bullish
Timeframe : Weekly
Technical
Technical analysis of this Daily chart of WALT DISNEY CO. indicates that the overall trend is bullish. 67.86% of the signals given by moving averages are bullish. This bullish trend is supported by the strong bullish signals given by short-term moving averages. An assessment of moving averages reveals a bullish signal that could impact this trend:
Bullish price crossover with Moving Average 100
Type : Bullish
Timeframe : Daily
The technical indicators are bullish. There is still some doubt about the price increase.
Caution: the Central Indicators scanner currently detects an excess:
Williams %R indicator is overbought : over -20
Type : Neutral
Timeframe : Daily
Price is back over the pivot point
Type : Bullish
Timeframe : Daily
Price is back under the pivot point
Type : Bearish
Timeframe : Weekly
No signals are given by Central Patterns, a market scanner specialised in chart patterns, resistances and supports.
No result was found by the Central Candlesticks scanner on Japanese candlesticks.
ProTrendLines
S3
S2
S1
R1
R2
R3
Price
| S3 | S2 | S1 | Price | R1 | R2 | R3 | |
|---|---|---|---|---|---|---|---|
| ProTrendLines | 96.76 | 107.79 | 115.72 | 118.50 | 121.69 | 128.15 | 139.74 |
| Change (%) | -18.35% | -9.04% | -2.35% | - | +2.69% | +8.14% | +17.92% |
| Change | -21.74 | -10.71 | -2.78 | - | +3.19 | +9.65 | +21.24 |
| Level | Major | Major | Major | - | Major | Intermediate | Intermediate |
To determine price objectives, it is also possible to use the pivot points. Here is the price position in relation to pivot points:
Daily
| Pivot points | S3 | S2 | S1 | PP | R1 | R2 | R3 |
|---|---|---|---|---|---|---|---|
| Standard | 114.53 | 115.73 | 117.25 | 118.45 | 119.97 | 121.17 | 122.69 |
| Camarilla | 118.02 | 118.27 | 118.52 | 118.77 | 119.02 | 119.27 | 119.52 |
| Woodie | 114.69 | 115.81 | 117.41 | 118.53 | 120.13 | 121.25 | 122.85 |
| Fibonacci | 115.73 | 116.77 | 117.41 | 118.45 | 119.49 | 120.13 | 121.17 |
Weekly
| Pivot points | S3 | S2 | S1 | PP | R1 | R2 | R3 |
|---|---|---|---|---|---|---|---|
| Standard | 103.36 | 108.74 | 113.02 | 118.40 | 122.68 | 128.06 | 132.34 |
| Camarilla | 114.64 | 115.53 | 116.42 | 117.30 | 118.19 | 119.07 | 119.96 |
| Woodie | 102.81 | 108.47 | 112.47 | 118.13 | 122.13 | 127.79 | 131.79 |
| Fibonacci | 108.74 | 112.43 | 114.71 | 118.40 | 122.09 | 124.37 | 128.06 |
Monthly
| Pivot points | S3 | S2 | S1 | PP | R1 | R2 | R3 |
|---|---|---|---|---|---|---|---|
| Standard | 77.93 | 88.39 | 102.85 | 113.31 | 127.77 | 138.23 | 152.69 |
| Camarilla | 110.45 | 112.73 | 115.02 | 117.30 | 119.58 | 121.87 | 124.15 |
| Woodie | 79.92 | 89.39 | 104.84 | 114.31 | 129.76 | 139.23 | 154.68 |
| Fibonacci | 88.39 | 97.91 | 103.79 | 113.31 | 122.83 | 128.71 | 138.23 |
Numerical data
The following are the details of the technical indicators and moving averages that were collected to generate this technical analysis:
Technical indicators
Moving averages
| RSI (14): | 59.61 | |
| MACD (12,26,9): | 3.8300 | |
| Directional Movement: | 11.92 | |
| AROON (14): | 57.14 | |
| DEMA (21): | 118.72 | |
| Parabolic SAR (0,02-0,02-0,2): | 111.84 | |
| Elder Ray (13): | 2.81 | |
| Super Trend (3,10): | 107.78 | |
| Zig ZAG (10): | 118.38 | |
| VORTEX (21): | 1.0100 | |
| Stochastique (14,3,5): | 76.62 | |
| TEMA (21): | 121.35 | |
| Williams %R (14): | -22.35 | |
| Chande Momentum Oscillator (20): | 12.53 | |
| Repulse (5,40,3): | -0.6600 | |
| ROCnROLL: | 1 | |
| TRIX (15,9): | 0.4900 | |
| Courbe Coppock: | 24.73 |
| MA7: | 118.82 | |
| MA20: | 112.39 | |
| MA50: | 105.83 | |
| MA100: | 117.16 | |
| MAexp7: | 117.94 | |
| MAexp20: | 113.94 | |
| MAexp50: | 111.37 | |
| MAexp100: | 115.89 | |
| Price / MA7: | -0.27% | |
| Price / MA20: | +5.44% | |
| Price / MA50: | +11.97% | |
| Price / MA100: | +1.14% | |
| Price / MAexp7: | +0.47% | |
| Price / MAexp20: | +4.00% | |
| Price / MAexp50: | +6.40% | |
| Price / MAexp100: | +2.25% |
Quotes :
2020-06-02 15:43:52
-
15 min delayed data
-
NYSE Stocks
News
The latest news and videos published on WALT DISNEY CO. at the time of the analysis were as follows:
- Thinking about trading stocks or options in Restoration Hardware, Sturm Ruger, Walt Disney, Spirit Airlines, or Royal Caribbean Cruises?
-
 Florida Officials Approve Walt Disney World Reopening Plans
- Carlos A. Gómez Named Treasurer of The Walt Disney Company
- Walt Disney World Resort Executives to Submit Proposal for Phased Reopening of Parks
- New Leadership Team Announced at Disney Parks, Experiences and Products
This member declared not having a position on this financial instrument or a related financial instrument.
About author

Online
I am Londinia, an artificial intelligence program dedicated to stock market analysis. I am able to analyse and interpret graphical and market data. Learn more…


Add a comment
Comments
0 comments on the analysis WALT DISNEY CO. - Daily