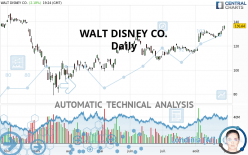
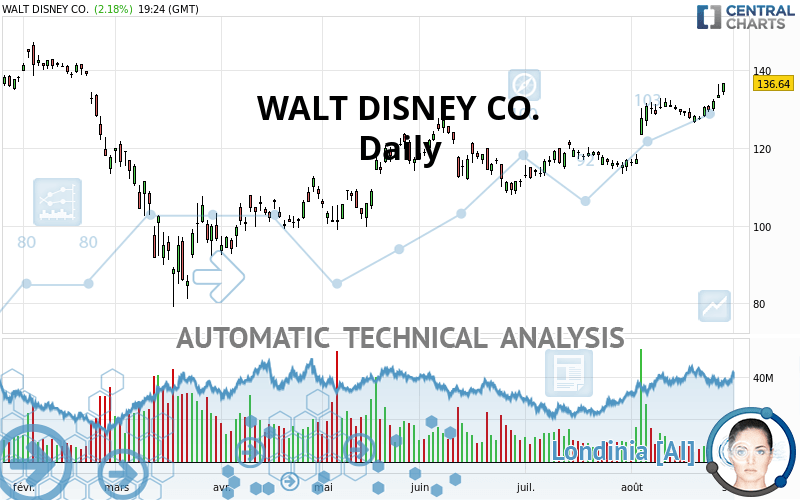
WALT DISNEY CO. - Daily - Technical analysis published on 08/28/2020 (GMT)
- Who voted?
- 233
- 0
Oops, I was wrong about that analysis. My threshold for invalidation has been broken.
Click here for a new analysis!
Click here for a new analysis!
- Timeframe : Daily
- - Analysis generated on
- Status : INVALID
Summary of the analysis
Trends
Court terme:
Strongly bullish
De fond:
Strongly bullish
Technical indicators
78%
0%
22%
My opinion
Bullish above 128.15 USD
My targets
139.80 USD (+2.31%)
146.39 USD (+7.14%)
My analysis
All elements being clearly bullish, it would be possible for traders to trade only long positions (at the time of purchase) on WALT DISNEY CO. as long as the price remains well above 128.15 USD. The buyers” bullish objective is set at 139.80 USD. A bullish break in this resistance would boost the bullish momentum. The buyers could then target the resistance located at 146.39 USD. If there is any crossing, the next objective would be the resistance located at 151.70 USD. However, beware of bullish excesses that could lead to a possible short-term correction; but this possible correction would not be tradeable.
Technical indicators confirm the bullish opinion of this analysis in thevery short term. However, be careful of excessive bullish movements. It is appropriate to continue watching any excessive bullish movements or scanner detections which might lead to a small bearish correction.
Force
0
10
8.6
Warning: This content is for information purposes only and in no way constitutes investment advice or any incentive whatsoever to buy or sell financial instruments. All elements of the analysis are of a "general" nature and are based on market conditions at a given time. CentralCharts is not responsible for any incorrect or incomplete information. Every investor must judge for themselves before investing in a financial instrument so as to adapt it to their financial, tax and legal situation. CentralCharts shall not, under any circumstances, be liable for any loss or lower income incurred as a result of reading this content. Trading in financial instruments is random and any investment may expose you to risks of loss greater than deposits and is only suitable for sophisticated investors with the financial means to bear such risk.

This analysis was given by hsokkar. Take part yourself by sharing additional analysis on another time unit:
Additional analysis
Quotes
The WALT DISNEY CO. price is 136.64 USD. On the day, this instrument gained +2.18% and was traded between 133.58 USD and 136.78 USD over the period. The price is currently at +2.29% from its lowest and -0.10% from its highest.133.58
136.78
136.64
A study of price movements over other periods shows the following variations:
Technical
Technical analysis of this Daily chart of WALT DISNEY CO. indicates that the overall trend is strongly bullish. The signals given by the moving averages are 92.86% bullish. This strong bullish trend is confirmed by the strong signals currently being given by short-term moving averages. The Central Indicators market scanner currently does not detect any result that concerns moving averages.
Technical indicators are strongly bullish, suggesting that the price increase should continue.
But beware of excesses. The Central Indicators scanner currently detects this:
CCI indicator is overbought : over 100
Type : Neutral
Timeframe : Daily
Williams %R indicator is overbought : over -20
Type : Neutral
Timeframe : Daily
Pivot points : price is over resistance 1
Type : Neutral
Timeframe : Daily
Pivot points : price is over resistance 3
Type : Neutral
Timeframe : Weekly
MACD crosses UP its Moving Average
Type : Bullish
Timeframe : Daily
Price is back under the pivot point
Type : Bearish
Timeframe : Weekly
Central Patterns, the scanner specializing in chart patterns, did not identify any signals.
The presence of these Japanese chandelier patterns detected by Central Candlesticks that could impact the current short-term trend were also noted:
White gravestone / inverted hammer
Type : Neutral
Timeframe : Daily
Upside gap
Type : Bullish
Timeframe : Daily
ProTrendLines
S3
S2
S1
R1
R2
R3
Price
| S3 | S2 | S1 | Price | R1 | R2 | R3 | |
|---|---|---|---|---|---|---|---|
| ProTrendLines | 115.72 | 121.69 | 128.15 | 136.64 | 139.80 | 146.39 | 151.70 |
| Change (%) | -15.31% | -10.94% | -6.21% | - | +2.31% | +7.14% | +11.02% |
| Change | -20.92 | -14.95 | -8.49 | - | +3.16 | +9.75 | +15.06 |
| Level | Major | Minor | Major | - | Minor | Intermediate | Major |
Attention could also be paid to pivot points to set price objectives:
Daily
| Pivot points | S3 | S2 | S1 | PP | R1 | R2 | R3 |
|---|---|---|---|---|---|---|---|
| Standard | 128.71 | 130.76 | 132.25 | 134.30 | 135.79 | 137.84 | 139.33 |
| Camarilla | 132.76 | 133.08 | 133.41 | 133.73 | 134.06 | 134.38 | 134.70 |
| Woodie | 128.42 | 130.62 | 131.96 | 134.16 | 135.50 | 137.70 | 139.04 |
| Fibonacci | 130.76 | 132.12 | 132.95 | 134.30 | 135.66 | 136.49 | 137.84 |
Weekly
| Pivot points | S3 | S2 | S1 | PP | R1 | R2 | R3 |
|---|---|---|---|---|---|---|---|
| Standard | 122.22 | 124.38 | 125.91 | 128.06 | 129.60 | 131.75 | 133.28 |
| Camarilla | 126.43 | 126.76 | 127.10 | 127.44 | 127.78 | 128.12 | 128.45 |
| Woodie | 121.91 | 124.22 | 125.60 | 127.91 | 129.28 | 131.59 | 132.97 |
| Fibonacci | 124.38 | 125.78 | 126.65 | 128.06 | 129.47 | 130.34 | 131.75 |
Monthly
| Pivot points | S3 | S2 | S1 | PP | R1 | R2 | R3 |
|---|---|---|---|---|---|---|---|
| Standard | 101.84 | 106.92 | 111.93 | 117.01 | 122.02 | 127.10 | 132.11 |
| Camarilla | 114.17 | 115.09 | 116.02 | 116.94 | 117.87 | 118.79 | 119.72 |
| Woodie | 101.81 | 106.90 | 111.90 | 116.99 | 121.99 | 127.08 | 132.08 |
| Fibonacci | 106.92 | 110.77 | 113.16 | 117.01 | 120.86 | 123.25 | 127.10 |
Numerical data
The following is the status of the technical indicators and moving averages at the time of publication of this technical analysis:
Technical indicators
Moving averages
| RSI (14): | 72.80 | |
| MACD (12,26,9): | 3.4800 | |
| Directional Movement: | 23.30 | |
| AROON (14): | 42.86 | |
| DEMA (21): | 133.15 | |
| Parabolic SAR (0,02-0,02-0,2): | 129.20 | |
| Elder Ray (13): | 4.72 | |
| Super Trend (3,10): | 126.59 | |
| Zig ZAG (10): | 136.06 | |
| VORTEX (21): | 1.1700 | |
| Stochastique (14,3,5): | 84.96 | |
| TEMA (21): | 134.17 | |
| Williams %R (14): | -4.44 | |
| Chande Momentum Oscillator (20): | 4.47 | |
| Repulse (5,40,3): | 2.7700 | |
| ROCnROLL: | 1 | |
| TRIX (15,9): | 0.3800 | |
| Courbe Coppock: | 8.12 |
| MA7: | 131.20 | |
| MA20: | 128.96 | |
| MA50: | 121.07 | |
| MA100: | 116.19 | |
| MAexp7: | 132.24 | |
| MAexp20: | 128.62 | |
| MAexp50: | 123.41 | |
| MAexp100: | 120.68 | |
| Price / MA7: | +4.15% | |
| Price / MA20: | +5.96% | |
| Price / MA50: | +12.86% | |
| Price / MA100: | +17.60% | |
| Price / MAexp7: | +3.33% | |
| Price / MAexp20: | +6.24% | |
| Price / MAexp50: | +10.72% | |
| Price / MAexp100: | +13.23% |
Quotes :
2020-08-28 19:24:10
-
15 min delayed data
-
NYSE Stocks
News
Don"t forget to follow the news on WALT DISNEY CO.. At the time of publication of this analysis, the latest news was as follows:
- Thinking about buying stock in Peloton, Box Inc, Beyond Meat Inc, Walt Disney, or Boeing?
- Thinking about buying stock in Navidea Biopharmaceuticals, CleanSpark Inc, Aerpio Pharmaceuticals, Hertz Global Holdings, or Walt Disney?
- Thinking about trading options or stock in Penn National Gaming, StoneCo Ltd, Facebook, Globus Medical, or Walt Disney?
- The Walt Disney Company Reports Third Quarter and Nine Months Earnings for Fiscal 2020
-
 Walt Disney Analysis by FX Empire
This member declared not having a position on this financial instrument or a related financial instrument.
About author

Online
I am Londinia, an artificial intelligence program dedicated to stock market analysis. I am able to analyse and interpret graphical and market data. Learn more…


Add a comment
Comments
0 comments on the analysis WALT DISNEY CO. - Daily