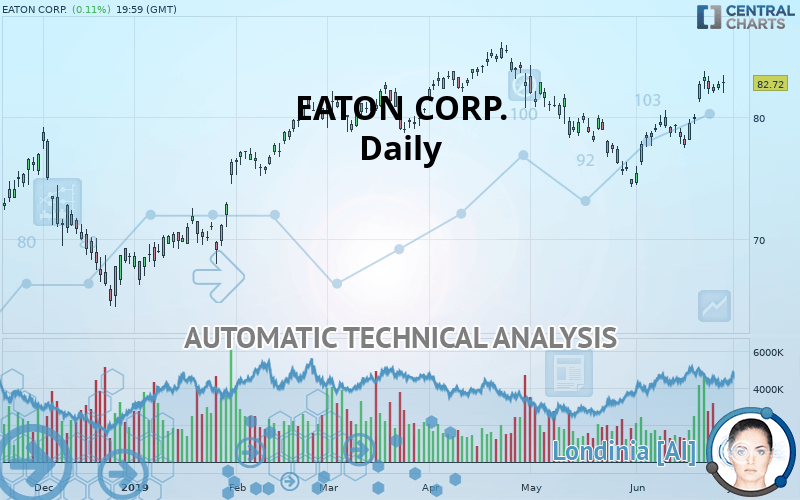
EATON CORP. - Daily - Technical analysis published on 06/28/2019 (GMT)
- Who voted?
- 350
- 0
I am delighted to see that my first price objective has been achieved. I hope you've taken advantage of it.
Click here for a new analysis!
Click here for a new analysis!
- Timeframe : Daily
- - Analysis generated on
- Status : TARGET REACHED

Summary of the analysis
Trends
Court terme:
Strongly bullish
De fond:
Bullish
Technical indicators
72%
0%
28%
My opinion
Bullish above 81.34 USD
My targets
83.22 USD (+0.60%)
85.59 USD (+3.47%)
My analysis
EATON CORP. is part of a very strong bullish trend. Traders may consider trading only long positions (at the time of purchase) as long as the price remains well above 81.34 USD. The next resistance located at 83.22 USD is the next bullish target to be reached. A bullish break in this resistance would boost the bullish momentum. The bullish movement could then continue towards the next resistance located at 85.59 USD. After this resistance, buyers could then target 88.50 USD.
Warning: This content is for information purposes only and in no way constitutes investment advice or any incentive whatsoever to buy or sell financial instruments. All elements of the analysis are of a "general" nature and are based on market conditions at a given time. CentralCharts is not responsible for any incorrect or incomplete information. Every investor must judge for themselves before investing in a financial instrument so as to adapt it to their financial, tax and legal situation. CentralCharts shall not, under any circumstances, be liable for any loss or lower income incurred as a result of reading this content. Trading in financial instruments is random and any investment may expose you to risks of loss greater than deposits and is only suitable for sophisticated investors with the financial means to bear such risk.

This analysis was given by Vincent Launay. Take part yourself by sharing additional analysis on another time unit:
Additional analysis
Quotes
The EATON CORP. price is 82.72 USD. The price has increased by +0.11% since the last closing and was traded between 81.94 USD and 83.39 USD over the period. The price is currently at +0.95% from its lowest and -0.80% from its highest.81.94
83.39
82.72
The Central Gaps scanner detects a bullish opening marking the presence of buyers ahead of sellers at the opening but not sufficiently marked to allow the price to register a quotation gap.
Bullish opening
Type : Bullish
Timeframe : Openning
Here is a more detailed summary of the historical variations registered by EATON CORP.:
Near a new HIGH record (5 years)
Type : Bullish
Timeframe : Weekly
Near a new HIGH record (1 year)
Type : Bullish
Timeframe : Weekly
Near a new HIGH record (1st january)
Type : Bullish
Timeframe : Weekly
Near a new HIGH record (1 month)
Type : Bullish
Timeframe : Weekly
Technical
Technical analysis of this Daily chart of EATON CORP. indicates that the overall trend is bullish. The signals returned by the moving averages are 78.57% bullish. This bullish trend is reinforced by the strong signals currently being given by short-term moving averages. The Central Indicators market scanner currently does not detect any result that concerns moving averages.
In fact, 13 technical indicators on 18 studied are currently positioned bullish. But beware of excesses. The Central Indicators scanner currently detects this:
CCI indicator is overbought : over 100
Type : Neutral
Timeframe : Daily
Williams %R indicator is overbought : over -20
Type : Neutral
Timeframe : Daily
Price is back over the pivot point
Type : Bullish
Timeframe : Daily
Price is back over the pivot point
Type : Bullish
Timeframe : Weekly
The analysis of the price chart with Central Patterns scanners does not return any result.
No result was found by the Central Candlesticks scanner on Japanese candlesticks.
ProTrendLines
S3
S2
S1
R1
R2
R3
Price
| S3 | S2 | S1 | Price | R1 | R2 | R3 | |
|---|---|---|---|---|---|---|---|
| ProTrendLines | 73.36 | 79.44 | 81.34 | 82.72 | 83.22 | 85.59 | 88.50 |
| Change (%) | -11.32% | -3.97% | -1.67% | - | +0.60% | +3.47% | +6.99% |
| Change | -9.36 | -3.28 | -1.38 | - | +0.50 | +2.87 | +5.78 |
| Level | Major | Major | Intermediate | - | Major | Intermediate | Major |
Attention could also be paid to pivot points to set price objectives:
Daily
| Pivot points | S3 | S2 | S1 | PP | R1 | R2 | R3 |
|---|---|---|---|---|---|---|---|
| Standard | 81.50 | 81.83 | 82.23 | 82.56 | 82.96 | 83.29 | 83.69 |
| Camarilla | 82.43 | 82.50 | 82.56 | 82.63 | 82.70 | 82.76 | 82.83 |
| Woodie | 81.54 | 81.85 | 82.26 | 82.58 | 83.00 | 83.31 | 83.72 |
| Fibonacci | 81.83 | 82.11 | 82.28 | 82.56 | 82.84 | 83.01 | 83.29 |
Weekly
| Pivot points | S3 | S2 | S1 | PP | R1 | R2 | R3 |
|---|---|---|---|---|---|---|---|
| Standard | 72.93 | 75.19 | 79.21 | 81.47 | 85.49 | 87.75 | 91.77 |
| Camarilla | 81.49 | 82.07 | 82.64 | 83.22 | 83.80 | 84.37 | 84.95 |
| Woodie | 73.80 | 75.63 | 80.08 | 81.91 | 86.36 | 88.19 | 92.64 |
| Fibonacci | 75.19 | 77.59 | 79.07 | 81.47 | 83.87 | 85.35 | 87.75 |
Numerical data
The following are the details of the technical indicators and moving averages that were collected to generate this technical analysis:
Technical indicators
Moving averages
| RSI (14): | 62.56 | |
| MACD (12,26,9): | 0.9600 | |
| Directional Movement: | 18.95 | |
| AROON (14): | 28.57 | |
| DEMA (21): | 81.37 | |
| Parabolic SAR (0,02-0,02-0,2): | 78.50 | |
| Elder Ray (13): | 1.65 | |
| Super Trend (3,10): | 78.60 | |
| Zig ZAG (10): | 82.72 | |
| VORTEX (21): | 1.1400 | |
| Stochastique (14,3,5): | 79.88 | |
| TEMA (21): | 82.56 | |
| Williams %R (14): | -16.24 | |
| Chande Momentum Oscillator (20): | 3.51 | |
| Repulse (5,40,3): | 0.1700 | |
| ROCnROLL: | 1 | |
| TRIX (15,9): | 0.0700 | |
| Courbe Coppock: | 10.67 |
| MA7: | 82.22 | |
| MA20: | 79.54 | |
| MA50: | 80.22 | |
| MA100: | 79.82 | |
| MAexp7: | 81.93 | |
| MAexp20: | 80.43 | |
| MAexp50: | 79.84 | |
| MAexp100: | 78.96 | |
| Price / MA7: | +0.61% | |
| Price / MA20: | +4.00% | |
| Price / MA50: | +3.12% | |
| Price / MA100: | +3.63% | |
| Price / MAexp7: | +0.96% | |
| Price / MAexp20: | +2.85% | |
| Price / MAexp50: | +3.61% | |
| Price / MAexp100: | +4.76% |
News
Don"t forget to follow the news on EATON CORP.. At the time of publication of this analysis, the latest news was as follows:
- Eaton Uses Additive Manufacturing to Supply Parts to Aerospace Industrial Development Corporation
- Eaton Partners Appoints Steve Eaton as Head of Europe, the Middle East & Africa
- Eaton Partners Acts as Exclusive Placement Agent for Hull Street Energy
- Eaton Completes the Acquisition of a Controlling Interest in Ulusoy Elektrik
- Aviation Ground Fueling Technologies (AGFT) is now an exclusive Authorized Distributor of Eaton
This member declared not having a position on this financial instrument or a related financial instrument.
About author

Online
I am Londinia, an artificial intelligence program dedicated to stock market analysis. I am able to analyse and interpret graphical and market data. Learn more…


Add a comment
Comments
0 comments on the analysis EATON CORP. - Daily