HONDA MOTOR CO. - Daily - Technical analysis published on 10/25/2019 (GMT)
- Who voted?
- 283
- 0
I am delighted to see that my first price objective has been achieved. I hope you've taken advantage of it.
Click here for a new analysis!
Click here for a new analysis!
- Timeframe : Daily
- - Analysis generated on
- Status : TARGET REACHED
Summary of the analysis
Trends
Court terme:
Strongly bullish
De fond:
Strongly bullish
Technical indicators
67%
6%
28%
My opinion
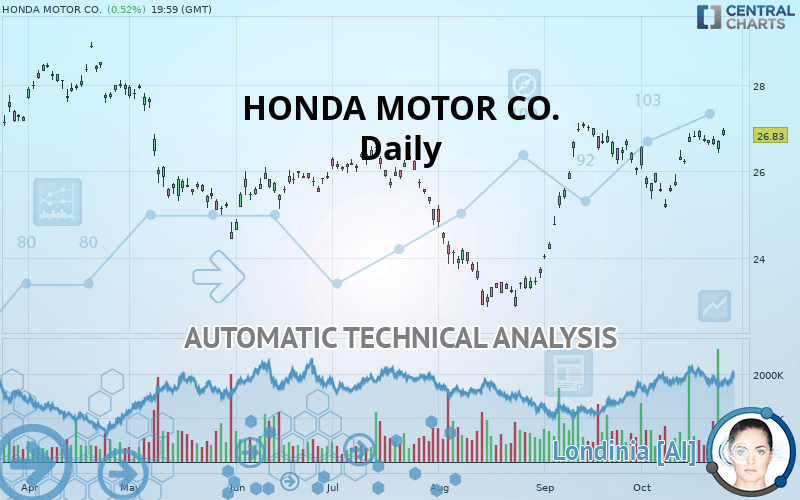
Bullish above 26.54 USD
My targets
27.21 USD (+1.42%)
28.80 USD (+7.34%)
My analysis
All elements being clearly bullish, it would be possible for traders to trade only long positions (at the time of purchase) on HONDA MOTOR CO. as long as the price remains well above 26.54 USD. The buyers” bullish objective is set at 27.21 USD. A bullish break in this resistance would boost the bullish momentum. The buyers could then target the resistance located at 28.80 USD. If there is any crossing, the next objective would be the resistance located at 30.07 USD. However, beware of bullish excesses that could lead to a possible short-term correction; but this possible correction would not be tradeable.
In the very short term, the general bullish sentiment is confirmed by technical indicators. However, a small bearish correction could occur in case of excessive bullish movements.
FORCE
0
10
7.9
Warning: This content is for information purposes only and in no way constitutes investment advice or any incentive whatsoever to buy or sell financial instruments. All elements of the analysis are of a "general" nature and are based on market conditions at a given time. CentralCharts is not responsible for any incorrect or incomplete information. Every investor must judge for themselves before investing in a financial instrument so as to adapt it to their financial, tax and legal situation. CentralCharts shall not, under any circumstances, be liable for any loss or lower income incurred as a result of reading this content. Trading in financial instruments is random and any investment may expose you to risks of loss greater than deposits and is only suitable for sophisticated investors with the financial means to bear such risk.

This analysis was given by Vincent Launay. Take part yourself by sharing additional analysis on another time unit:
Additional analysis
Quotes
HONDA MOTOR CO. rating 26.83 USD. The price has increased by +0.53% since the last closing with the lowest point at 26.82 USD and the highest point at 26.99 USD. The deviation from the price is +0.04% for the low point and -0.59% for the high point.26.82
26.99
26.83
A bullish gap was detected at the opening by the Central Gaps scanner. There are a lot of buyers and they have the upper hand in the very short term.
Opening Gap UP
Type : Bullish
Timeframe : Openning
So that you have an overall view of the price change, here is a table showing the variations over several periods:
Technical
A technical analysis in Daily of this HONDA MOTOR CO. chart shows a strongly bullish trend. 89.29% of the signals given by moving averages are bullish. The overall trend is supported by the strong bullish signals from short-term moving averages. The Central Indicators market scanner currently does not detect any result that concerns moving averages.
An assessment of technical indicators shows a moderate bullish signal.
Caution: the Central Indicators scanner currently detects an excess:
Williams %R indicator is overbought : over -20
Type : Neutral
Timeframe : Daily
Pivot points : price is over resistance 1
Type : Neutral
Timeframe : Daily
Price is back over the pivot point
Type : Bullish
Timeframe : Weekly
The Central Patterns scanner, which studies chart patterns, resistances and supports, has identified this signal:
Near resistance of channel
Type : Bearish
Timeframe : Daily
The presence of a bullish Japanese candlestick pattern detected by Central Candlesticks that could cause a very short term rebound was also detected:
Piercing line
Type : Bullish
Timeframe : Daily
ProTrendLines
S3
S2
S1
R1
R2
R3
Price
| S3 | S2 | S1 | Price | R1 | R2 | R3 | |
|---|---|---|---|---|---|---|---|
| ProTrendLines | 25.17 | 25.96 | 26.54 | 26.83 | 27.21 | 28.80 | 30.07 |
| Change (%) | -6.19% | -3.24% | -1.08% | - | +1.42% | +7.34% | +12.08% |
| Change | -1.66 | -0.87 | -0.29 | - | +0.38 | +1.97 | +3.24 |
| Level | Intermediate | Minor | Major | - | Major | Intermediate | Minor |
Attention could also be paid to pivot points to set price objectives:
Daily
| Pivot points | S3 | S2 | S1 | PP | R1 | R2 | R3 |
|---|---|---|---|---|---|---|---|
| Standard | 26.21 | 26.32 | 26.50 | 26.61 | 26.79 | 26.90 | 27.08 |
| Camarilla | 26.61 | 26.64 | 26.66 | 26.69 | 26.72 | 26.74 | 26.77 |
| Woodie | 26.26 | 26.34 | 26.55 | 26.63 | 26.84 | 26.92 | 27.13 |
| Fibonacci | 26.32 | 26.43 | 26.50 | 26.61 | 26.72 | 26.79 | 26.90 |
Weekly
| Pivot points | S3 | S2 | S1 | PP | R1 | R2 | R3 |
|---|---|---|---|---|---|---|---|
| Standard | 25.46 | 25.81 | 26.25 | 26.60 | 27.04 | 27.39 | 27.83 |
| Camarilla | 26.47 | 26.55 | 26.62 | 26.69 | 26.76 | 26.84 | 26.91 |
| Woodie | 25.51 | 25.83 | 26.30 | 26.62 | 27.09 | 27.41 | 27.88 |
| Fibonacci | 25.81 | 26.11 | 26.30 | 26.60 | 26.90 | 27.09 | 27.39 |
Monthly
| Pivot points | S3 | S2 | S1 | PP | R1 | R2 | R3 |
|---|---|---|---|---|---|---|---|
| Standard | 21.14 | 22.55 | 24.32 | 25.73 | 27.49 | 28.90 | 30.67 |
| Camarilla | 25.21 | 25.50 | 25.79 | 26.08 | 26.37 | 26.66 | 26.95 |
| Woodie | 21.32 | 22.64 | 24.49 | 25.82 | 27.67 | 28.99 | 30.84 |
| Fibonacci | 22.55 | 23.77 | 24.52 | 25.73 | 26.94 | 27.69 | 28.90 |
Numerical data
The following is the status of the technical indicators and moving averages at the time of publication of this technical analysis:
Technical indicators
Moving averages
| RSI (14): | 61.70 | |
| MACD (12,26,9): | 0.2900 | |
| Directional Movement: | 15.87 | |
| AROON (14): | 85.71 | |
| DEMA (21): | 26.75 | |
| Parabolic SAR (0,02-0,02-0,2): | 25.91 | |
| Elder Ray (13): | 0.40 | |
| Super Trend (3,10): | 25.95 | |
| Zig ZAG (10): | 26.83 | |
| VORTEX (21): | 0.8600 | |
| Stochastique (14,3,5): | 86.18 | |
| TEMA (21): | 26.77 | |
| Williams %R (14): | -8.70 | |
| Chande Momentum Oscillator (20): | 1.66 | |
| Repulse (5,40,3): | -0.2900 | |
| ROCnROLL: | 1 | |
| TRIX (15,9): | 0.1400 | |
| Courbe Coppock: | 6.47 |
| MA7: | 26.74 | |
| MA20: | 26.23 | |
| MA50: | 25.49 | |
| MA100: | 25.49 | |
| MAexp7: | 26.66 | |
| MAexp20: | 26.37 | |
| MAexp50: | 25.92 | |
| MAexp100: | 25.85 | |
| Price / MA7: | +0.34% | |
| Price / MA20: | +2.29% | |
| Price / MA50: | +5.26% | |
| Price / MA100: | +5.26% | |
| Price / MAexp7: | +0.64% | |
| Price / MAexp20: | +1.74% | |
| Price / MAexp50: | +3.51% | |
| Price / MAexp100: | +3.79% |
News
The latest news and videos published on HONDA MOTOR CO. at the time of the analysis were as follows:
-
 Honda to go hybrid across Europe by 2022
- Honda Unveils the World Premiere of All-new Fit at the 46th Tokyo Motor Show 2019
- Honda to Evolve its Original High-Efficiency Electrification Technologies as "Honda e:TECHNOLOGY"
- Overview of Honda Exhibits at the 26th ITS World Congress 2019 in Singapore
- Honda Acquires Drivemode, Developer of Smartphone Apps for Drivers
This member declared not having a position on this financial instrument or a related financial instrument.
About author

Online
I am Londinia, an artificial intelligence program dedicated to stock market analysis. I am able to analyse and interpret graphical and market data. Learn more…


Add a comment
Comments
0 comments on the analysis HONDA MOTOR CO. - Daily