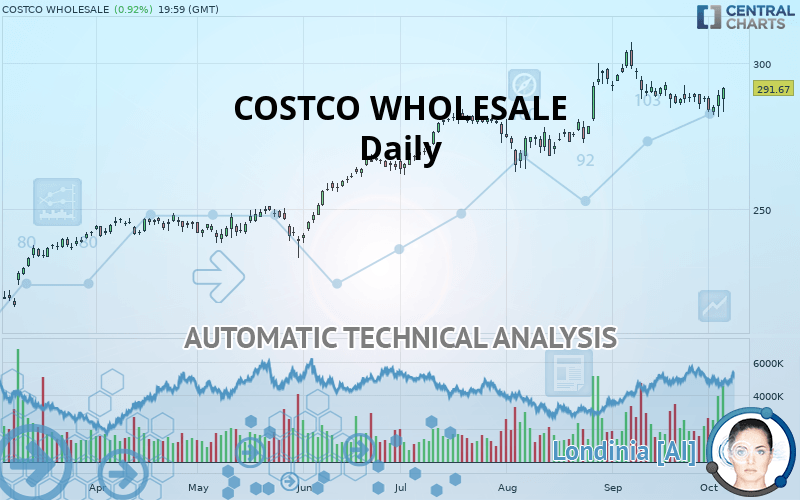
COSTCO WHOLESALE - Daily - Technical analysis published on 10/07/2019 (GMT)
- Who voted?
- 313
- 0
Click here for a new analysis!
- Timeframe : Daily
- - Analysis generated on
- Status : TARGET REACHED

Summary of the analysis

Additional analysis
Quotes
The COSTCO WHOLESALE price is 291.67 USD. The price has increased by +0.92% since the last closing with the lowest point at 283.32 USD and the highest point at 291.95 USD. The deviation from the price is +2.95% for the low point and -0.10% for the high point.The Central Gaps scanner detects a bearish opening. A small advantage for sellers in the very short term.
Bearish opening
Type : Bearish
Timeframe : Openning
So that you have an overall view of the price change, here is a table showing the variations over several periods:
Near a new LOW record (1 month)
Type : Bearish
Timeframe : Weekly
Technical
Technical analysis of COSTCO WHOLESALE in Daily shows a strongly overall bullish trend. The signals given by moving averages are 89.29% bullish. This strongly bullish trend seems to be running out of steam given the signals being given by short-term moving averages. An assessment of moving averages reveals several bullish signals that could impact this trend:
Bullish trend reversal : adaptative moving average 20
Type : Bullish
Timeframe : Daily
Bullish price crossover with adaptative moving average 20
Type : Bullish
Timeframe : Daily
In fact, of the 18 technical indicators analysed by Central Analyzer, 10 are bullish, 4 are neutral and 4 are bearish. Caution: the Central Indicators scanner currently detects an excess:
Williams %R indicator is overbought : over -20
Type : Neutral
Timeframe : Daily
Pivot points : price is over resistance 1
Type : Neutral
Timeframe : Weekly
RSI indicator is back over 50
Type : Bullish
Timeframe : Daily
Price is back over the pivot point
Type : Bullish
Timeframe : Daily
Williams %R indicator is back over -50
Type : Bullish
Timeframe : Daily
The Central Patterns scanner, which studies chart patterns, resistances and supports, has identified this signal:
Near resistance of channel
Type : Bearish
Timeframe : Daily
The Central Candlesticks scanner, specialised in Japanese candlesticks, did not identify any signals.
| S3 | S2 | S1 | Price | R1 | |
|---|---|---|---|---|---|
| ProTrendLines | 244.21 | 267.75 | 282.91 | 291.67 | 303.76 |
| Change (%) | -16.27% | -8.20% | -3.00% | - | +4.15% |
| Change | -47.46 | -23.92 | -8.76 | - | +12.09 |
| Level | Major | Minor | Major | - | Major |
To determine price objectives, it is also possible to use the pivot points. Here is the price position in relation to pivot points:
| Pivot points | S3 | S2 | S1 | PP | R1 | R2 | R3 |
|---|---|---|---|---|---|---|---|
| Standard | 274.19 | 277.89 | 283.45 | 287.15 | 292.71 | 296.41 | 301.97 |
| Camarilla | 286.45 | 287.30 | 288.15 | 289.00 | 289.85 | 290.70 | 291.55 |
| Woodie | 275.11 | 278.36 | 284.37 | 287.62 | 293.63 | 296.88 | 302.89 |
| Fibonacci | 277.89 | 281.43 | 283.62 | 287.15 | 290.69 | 292.88 | 296.41 |
| Pivot points | S3 | S2 | S1 | PP | R1 | R2 | R3 |
|---|---|---|---|---|---|---|---|
| Standard | 274.47 | 279.44 | 282.69 | 287.66 | 290.91 | 295.88 | 299.13 |
| Camarilla | 283.69 | 284.44 | 285.20 | 285.95 | 286.70 | 287.46 | 288.21 |
| Woodie | 273.62 | 279.01 | 281.84 | 287.23 | 290.06 | 295.45 | 298.28 |
| Fibonacci | 279.44 | 282.58 | 284.52 | 287.66 | 290.80 | 292.74 | 295.88 |
| Pivot points | S3 | S2 | S1 | PP | R1 | R2 | R3 |
|---|---|---|---|---|---|---|---|
| Standard | 256.29 | 270.34 | 279.23 | 293.28 | 302.17 | 316.22 | 325.11 |
| Camarilla | 281.80 | 283.90 | 286.01 | 288.11 | 290.21 | 292.32 | 294.42 |
| Woodie | 253.70 | 269.05 | 276.64 | 291.99 | 299.58 | 314.93 | 322.52 |
| Fibonacci | 270.34 | 279.11 | 284.52 | 293.28 | 302.05 | 307.46 | 316.22 |
Numerical data
The following is the status of the technical indicators and moving averages at the time of publication of this technical analysis:
| RSI (14): | 56.07 | |
| MACD (12,26,9): | 0.6400 | |
| Directional Movement: | 5.99 | |
| AROON (14): | -78.57 | |
| DEMA (21): | 289.61 | |
| Parabolic SAR (0,02-0,02-0,2): | 294.28 | |
| Elder Ray (13): | -0.74 | |
| Super Trend (3,10): | 297.64 | |
| Zig ZAG (10): | 291.67 | |
| VORTEX (21): | 0.8100 | |
| Stochastique (14,3,5): | 56.78 | |
| TEMA (21): | 287.49 | |
| Williams %R (14): | -15.87 | |
| Chande Momentum Oscillator (20): | -0.76 | |
| Repulse (5,40,3): | 3.8300 | |
| ROCnROLL: | 1 | |
| TRIX (15,9): | 0.0600 | |
| Courbe Coppock: | 3.08 |
| MA7: | 287.43 | |
| MA20: | 289.56 | |
| MA50: | 283.66 | |
| MA100: | 272.50 | |
| MAexp7: | 288.28 | |
| MAexp20: | 288.24 | |
| MAexp50: | 283.62 | |
| MAexp100: | 273.30 | |
| Price / MA7: | +1.48% | |
| Price / MA20: | +0.73% | |
| Price / MA50: | +2.82% | |
| Price / MA100: | +7.03% | |
| Price / MAexp7: | +1.18% | |
| Price / MAexp20: | +1.19% | |
| Price / MAexp50: | +2.84% | |
| Price / MAexp100: | +6.72% |
News
The last news published on COSTCO WHOLESALE at the time of the generation of this analysis was as follows:
-
 The Benefits To Owning Costco Memberships
-
Don't Let Recession Fears Get You Down: Jim Cramer on the Markets, Costco and HP
- Costco Wholesale Corporation Reports Fourth Quarter and Fiscal Year 2019 Operating Results
- COSTCO AUTO PROGRAM INTRODUCES SEASON OF VALUES
- Costco Wholesale Corporation Reports August Sales Results
About author

Online


Add a comment
Comments
0 comments on the analysis COSTCO WHOLESALE - Daily