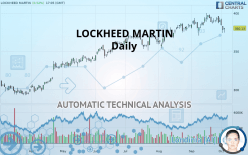
LOCKHEED MARTIN - Daily - Technical analysis published on 10/03/2019 (GMT)
- Who voted?
- 231
- 0
Click here for a new analysis!
- Timeframe : Daily
- - Analysis generated on
- Status : TARGET REACHED

Summary of the analysis

Additional analysis
Quotes
LOCKHEED MARTIN rating 380.13 USD. The price has increased by +0.52% since the last closing and was between 374.33 USD and 380.42 USD. This implies that the price is at +1.55% from its lowest and at -0.08% from its highest.The Central Gaps scanner detects a bullish opening marking the presence of buyers ahead of sellers at the opening but not sufficiently marked to allow the price to register a quotation gap.
Bullish opening
Type : Bullish
Timeframe : Openning
Here is a more detailed summary of the historical variations registered by LOCKHEED MARTIN:
Near a new HIGH record (5 years)
Type : Bullish
Timeframe : Weekly
Near a new LOW record (1 month)
Type : Bearish
Timeframe : Weekly
Technical
Technical analysis of this Daily chart of LOCKHEED MARTIN indicates that the overall trend is bullish. 71.43% of the signals given by moving averages are bullish. Caution: the neutral signals currently given by short-term moving averages show us that the global trend is losing momentum. The Central Indicators market scanner is currently detecting several bearish signals that could impact this trend:
Bearish price crossover with Moving Average 50
Type : Bearish
Timeframe : Daily
Bearish price crossover with adaptative moving average 20
Type : Bearish
Timeframe : Daily
Bearish price crossover with adaptative moving average 50
Type : Bearish
Timeframe : Daily
Bearish price crossover with adaptative moving average 100
Type : Bearish
Timeframe : Daily
In fact, according to the parameters integrated into the Central Analyzer system, 11 technical indicators out of 18 analysed are currently bearish. Caution: the Central Indicators scanner currently detects an excess:
CCI indicator is oversold : under -100
Type : Neutral
Timeframe : Daily
Williams %R indicator is oversold : under -80
Type : Neutral
Timeframe : Daily
Pivot points : price is under support 3
Type : Neutral
Timeframe : Weekly
Parabolic SAR indicator bearish reversal
Type : Bearish
Timeframe : Daily
Aroon indicator bearish trend
Type : Bearish
Timeframe : Daily
Ichimoku - Bearish crossover : Tenkan & Kijun
Type : Bearish
Timeframe : Daily
Price is back under the pivot point
Type : Bearish
Timeframe : Daily
The Central Patterns scanner, which studies chart patterns, resistances and supports, has identified these signals:
Horizontal support is broken
Type : Bearish
Timeframe : Daily
Support of channel is broken
Type : Bearish
Timeframe : Daily
For a small setback in the very short term, the Central Candlesticks scanner currently notes the presence of this bearish pattern in Japanese candlesticks:
Downside gap
Type : Bearish
Timeframe : Daily
| S3 | S2 | S1 | Price | R1 | |
|---|---|---|---|---|---|
| ProTrendLines | 294.50 | 309.47 | 361.00 | 380.13 | 387.95 |
| Change (%) | -22.53% | -18.59% | -5.03% | - | +2.06% |
| Change | -85.63 | -70.66 | -19.13 | - | +7.82 |
| Level | Intermediate | Minor | Major | - | Major |
Pivot points can also be used to set your price objectives. Here is the price situation in relation to pivot points:
| Pivot points | S3 | S2 | S1 | PP | R1 | R2 | R3 |
|---|---|---|---|---|---|---|---|
| Standard | 364.81 | 369.44 | 373.80 | 378.43 | 382.79 | 387.42 | 391.78 |
| Camarilla | 375.69 | 376.51 | 377.34 | 378.16 | 378.98 | 379.81 | 380.63 |
| Woodie | 364.67 | 369.37 | 373.66 | 378.36 | 382.66 | 387.35 | 391.65 |
| Fibonacci | 369.44 | 372.87 | 374.99 | 378.43 | 381.86 | 383.99 | 387.42 |
| Pivot points | S3 | S2 | S1 | PP | R1 | R2 | R3 |
|---|---|---|---|---|---|---|---|
| Standard | 374.16 | 380.14 | 384.00 | 389.98 | 393.84 | 399.82 | 403.68 |
| Camarilla | 385.16 | 386.07 | 386.97 | 387.87 | 388.77 | 389.67 | 390.58 |
| Woodie | 373.11 | 379.61 | 382.95 | 389.45 | 392.79 | 399.29 | 402.63 |
| Fibonacci | 380.14 | 383.90 | 386.22 | 389.98 | 393.74 | 396.06 | 399.82 |
| Pivot points | S3 | S2 | S1 | PP | R1 | R2 | R3 |
|---|---|---|---|---|---|---|---|
| Standard | 344.19 | 357.33 | 373.69 | 386.83 | 403.19 | 416.33 | 432.69 |
| Camarilla | 381.95 | 384.65 | 387.36 | 390.06 | 392.76 | 395.47 | 398.17 |
| Woodie | 345.81 | 358.14 | 375.31 | 387.64 | 404.81 | 417.14 | 434.31 |
| Fibonacci | 357.33 | 368.60 | 375.56 | 386.83 | 398.10 | 405.06 | 416.33 |
Numerical data
The following is the status of the technical indicators and moving averages at the time of publication of this technical analysis:
| RSI (14): | 44.47 | |
| MACD (12,26,9): | 1.1600 | |
| Directional Movement: | -8.23 | |
| AROON (14): | -78.57 | |
| DEMA (21): | 388.25 | |
| Parabolic SAR (0,02-0,02-0,2): | 399.44 | |
| Elder Ray (13): | -8.58 | |
| Super Trend (3,10): | 375.36 | |
| Zig ZAG (10): | 380.15 | |
| VORTEX (21): | 0.8900 | |
| Stochastique (14,3,5): | 14.69 | |
| TEMA (21): | 385.34 | |
| Williams %R (14): | -77.85 | |
| Chande Momentum Oscillator (20): | -14.18 | |
| Repulse (5,40,3): | -1.3000 | |
| ROCnROLL: | -1 | |
| TRIX (15,9): | 0.1200 | |
| Courbe Coppock: | 0.65 |
| MA7: | 386.27 | |
| MA20: | 387.32 | |
| MA50: | 379.05 | |
| MA100: | 365.17 | |
| MAexp7: | 384.49 | |
| MAexp20: | 385.64 | |
| MAexp50: | 378.74 | |
| MAexp100: | 364.68 | |
| Price / MA7: | -1.59% | |
| Price / MA20: | -1.86% | |
| Price / MA50: | +0.28% | |
| Price / MA100: | +4.10% | |
| Price / MAexp7: | -1.13% | |
| Price / MAexp20: | -1.43% | |
| Price / MAexp50: | +0.37% | |
| Price / MAexp100: | +4.24% |
News
Don"t forget to follow the news on LOCKHEED MARTIN. At the time of publication of this analysis, the latest news was as follows:
- Timothy Cahill Named to Lead Lockheed Martin International
- Aramark Awarded Management Contract for Lockheed Martin Center for Leadership Excellence
- U.S. Army Awards Lockheed Martin Contract to Develop Sentinel A4 Radar
- Lockheed Martin Increases Share Repurchase Authority by $1.0 Billion
- Lockheed Martin Declares Fourth Quarter 2019 Dividend
About author

Online


Add a comment
Comments
0 comments on the analysis LOCKHEED MARTIN - Daily