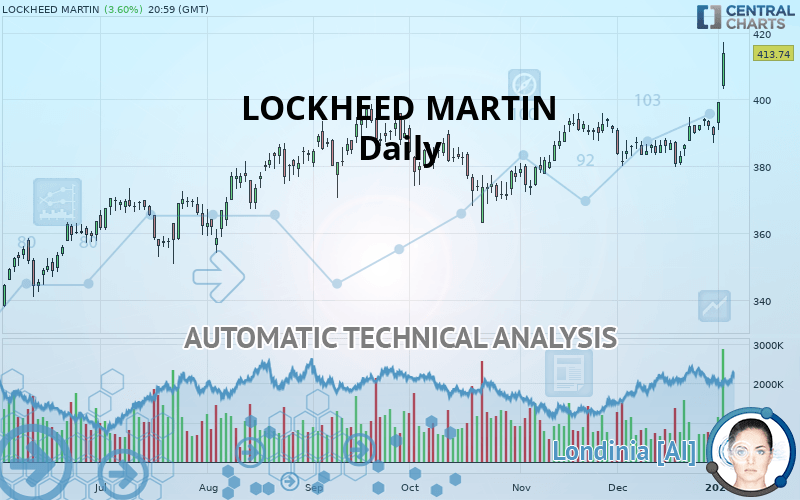
LOCKHEED MARTIN - Daily - Technical analysis published on 01/05/2020 (GMT)
- 381
- 0
- Timeframe : Daily
- - Analysis generated on
- Status : WITHOUT TARGET

Summary of the analysis

Additional analysis
Quotes
LOCKHEED MARTIN rating 413.74 USD. The price has increased by +3.60% since the last closing and was between 403.00 USD and 417.17 USD. This implies that the price is at +2.67% from its lowest and at -0.82% from its highest.A bullish gap was detected at the opening by the Central Gaps scanner. There are a lot of buyers and they have the upper hand in the very short term.
Opening Gap UP
Type : Bullish
Timeframe : Openning
Here is a more detailed summary of the historical variations registered by LOCKHEED MARTIN:
New HIGH record (5 years)
Type : Bullish
Timeframe : Weekly
New HIGH record (1 year)
Type : Bullish
Timeframe : Weekly
New HIGH record (1st january)
Type : Bullish
Timeframe : Weekly
Near a new LOW record (1st january)
Type : Bearish
Timeframe : Weekly
New HIGH record (1 month)
Type : Bullish
Timeframe : Weekly
Near a new LOW record (1 month)
Type : Bearish
Timeframe : Weekly
Technical
Technical analysis of this Daily chart of LOCKHEED MARTIN indicates that the overall trend is strongly bullish. 92.86% of the signals given by moving averages are bullish. The overall trend is supported by the strong bullish signals from short-term moving averages. The Central Indicators market scanner currently does not detect any result that concerns moving averages.
In fact, 17 technical indicators on 18 studied are currently bullish. Caution: the Central Indicators scanner currently detects an excess:
CCI indicator is overbought : over 100
Type : Neutral
Timeframe : Daily
Williams %R indicator is overbought : over -20
Type : Neutral
Timeframe : Daily
Pivot points : price is over resistance 3
Type : Neutral
Timeframe : Daily
Pivot points : price is over resistance 3
Type : Neutral
Timeframe : Weekly
Ichimoku - Bullish crossover : Tenkan & Kijun
Type : Bullish
Timeframe : Daily
Central Patterns, the market scanner focusing on chart patterns, resistances and supports found this result:
Resistance of channel is broken
Type : Bullish
Timeframe : Daily
The Central Candlesticks scanner, specialised in Japanese candlesticks, did not identify any signals.
| S3 | S2 | S1 | Price | |
|---|---|---|---|---|
| ProTrendLines | 361.00 | 370.51 | 397.04 | 413.74 |
| Change (%) | -12.75% | -10.45% | -4.04% | - |
| Change | -52.74 | -43.23 | -16.70 | - |
| Level | Major | Major | Major | - |
Attention could also be paid to pivot points to set price objectives:
| Pivot points | S3 | S2 | S1 | PP | R1 | R2 | R3 |
|---|---|---|---|---|---|---|---|
| Standard | 385.34 | 388.14 | 393.76 | 396.56 | 402.18 | 404.98 | 410.60 |
| Camarilla | 397.05 | 397.83 | 398.60 | 399.37 | 400.14 | 400.91 | 401.69 |
| Woodie | 386.74 | 388.85 | 395.16 | 397.27 | 403.58 | 405.69 | 412.00 |
| Fibonacci | 388.14 | 391.36 | 393.35 | 396.56 | 399.78 | 401.77 | 404.98 |
| Pivot points | S3 | S2 | S1 | PP | R1 | R2 | R3 |
|---|---|---|---|---|---|---|---|
| Standard | 382.13 | 384.86 | 389.23 | 391.96 | 396.33 | 399.06 | 403.43 |
| Camarilla | 391.65 | 392.30 | 392.95 | 393.60 | 394.25 | 394.90 | 395.55 |
| Woodie | 382.95 | 385.27 | 390.05 | 392.37 | 397.15 | 399.47 | 404.25 |
| Fibonacci | 384.86 | 387.57 | 389.25 | 391.96 | 394.67 | 396.35 | 399.06 |
| Pivot points | S3 | S2 | S1 | PP | R1 | R2 | R3 |
|---|---|---|---|---|---|---|---|
| Standard | 366.10 | 372.88 | 381.13 | 387.91 | 396.16 | 402.94 | 411.19 |
| Camarilla | 385.25 | 386.63 | 388.00 | 389.38 | 390.76 | 392.14 | 393.51 |
| Woodie | 366.84 | 373.25 | 381.87 | 388.28 | 396.90 | 403.31 | 411.93 |
| Fibonacci | 372.88 | 378.62 | 382.17 | 387.91 | 393.65 | 397.20 | 402.94 |
Numerical data
The following are the details of the technical indicators and moving averages that were collected to generate this technical analysis:
| RSI (14): | 74.33 | |
| MACD (12,26,9): | 4.2300 | |
| Directional Movement: | 32.88 | |
| AROON (14): | 71.43 | |
| DEMA (21): | 396.07 | |
| Parabolic SAR (0,02-0,02-0,2): | 382.10 | |
| Elder Ray (13): | 16.37 | |
| Super Trend (3,10): | 391.91 | |
| Zig ZAG (10): | 413.74 | |
| VORTEX (21): | 1.1400 | |
| Stochastique (14,3,5): | 85.18 | |
| TEMA (21): | 398.73 | |
| Williams %R (14): | -9.14 | |
| Chande Momentum Oscillator (20): | 27.79 | |
| Repulse (5,40,3): | 4.1600 | |
| ROCnROLL: | 1 | |
| TRIX (15,9): | 0.0800 | |
| Courbe Coppock: | 5.80 |
| MA7: | 395.76 | |
| MA20: | 389.13 | |
| MA50: | 384.41 | |
| MA100: | 382.46 | |
| MAexp7: | 397.77 | |
| MAexp20: | 391.34 | |
| MAexp50: | 386.33 | |
| MAexp100: | 378.50 | |
| Price / MA7: | +4.54% | |
| Price / MA20: | +6.32% | |
| Price / MA50: | +7.63% | |
| Price / MA100: | +8.18% | |
| Price / MAexp7: | +4.01% | |
| Price / MAexp20: | +5.72% | |
| Price / MAexp50: | +7.09% | |
| Price / MAexp100: | +9.31% |
News
The last news published on LOCKHEED MARTIN at the time of the generation of this analysis was as follows:
- Lockheed Martin Delivers 134 F-35s in 2019, Exceeding Annual Commitment
- GomSpace, Lockheed Martin Space and Orbital Micro Systems Team up for new Microwave Sensing Nanosatellite Project
- GomSpace, Lockheed Martin Space and Orbital Micro Systems Team up for new Microwave Sensing Nanosatellite Project
- GomSpace, Lockheed Martin Space and Orbital Micro Systems Team up for new Microwave Sensing Nanosatellite Project
- Lockheed Martin Hosts Bahrain Ambassador at F-16 Production Line
About author

Online


Add a comment
Comments
0 comments on the analysis LOCKHEED MARTIN - Daily