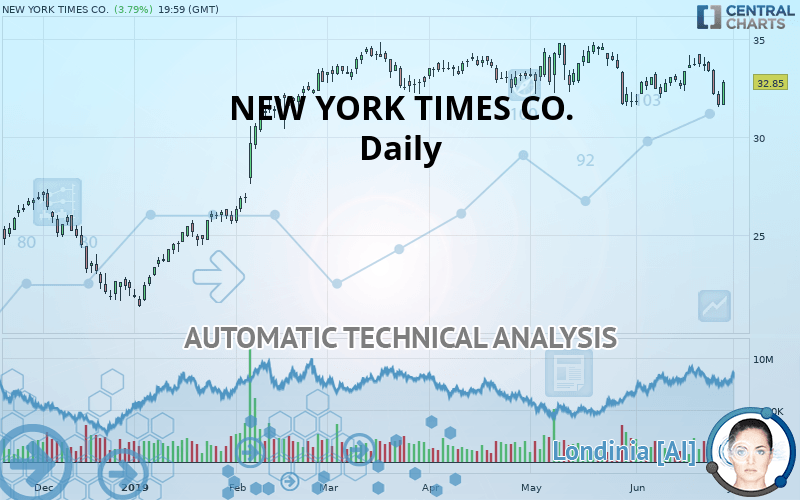
NEW YORK TIMES CO. - Daily - Technical analysis published on 06/28/2019 (GMT)
- Who voted?
- 245
- 0
- Timeframe : Daily
- - Analysis generated on
- Status : NEUTRAL

Summary of the analysis
Trends
Court terme:
Neutral
De fond:
Neutral
Technical indicators
33%
22%
44%
My opinion
Neutral between 32.55 USD and 34.59 USD
My targets
-
My analysis
The short-term and basic trend is neutral. In this situation, the price of NEW YORK TIMES CO. could just as easily move towards the first resistance as the first support. No statistical advantage is given for one of these levels to be achieved before the other. It will be necessary to create a new automated analysis when the conditions have progressed. This may be the case, for example, when the first resistance has been broken above or the first support has been broken below. The first resistance is located at 34.59 USD. The first support is located at 32.55 USD.
Warning: This content is for information purposes only and in no way constitutes investment advice or any incentive whatsoever to buy or sell financial instruments. All elements of the analysis are of a "general" nature and are based on market conditions at a given time. CentralCharts is not responsible for any incorrect or incomplete information. Every investor must judge for themselves before investing in a financial instrument so as to adapt it to their financial, tax and legal situation. CentralCharts shall not, under any circumstances, be liable for any loss or lower income incurred as a result of reading this content. Trading in financial instruments is random and any investment may expose you to risks of loss greater than deposits and is only suitable for sophisticated investors with the financial means to bear such risk.

This analysis was given by Vincent Launay. Take part yourself by sharing additional analysis on another time unit:
Additional analysis
Quotes
The NEW YORK TIMES CO. price is 32.85 USD. On the day, this instrument gained +3.79% and was between 31.64 USD and 32.95 USD. This implies that the price is at +3.82% from its lowest and at -0.30% from its highest.31.64
32.95
32.85
The Central Gaps scanner detects a bullish opening marking the presence of sellers ahead of buyers at the opening but not sufficiently marked to allow the price to register a quotation gap.
Bearish opening
Type : Bearish
Timeframe : Openning
So that you have an overall view of the price change, here is a table showing the variations over several periods:
Near a new HIGH record (5 years)
Type : Bullish
Timeframe : Weekly
Technical
A technical analysis in Daily of this NEW YORK TIMES CO. chart shows a neutral trend. This indecision is confirmed by the neutral signals currently being given by short-term moving averages. The Central Indicators market scanner currently does not detect any result that concerns moving averages.
In fact, of the 18 technical indicators analysed by Central Analyzer, 6 are bullish, 8 are neutral and 4 are bearish. Caution: the Central Indicators scanner currently detects an excess:
CCI indicator is oversold : under -100
Type : Neutral
Timeframe : Daily
Williams %R indicator is oversold : under -80
Type : Neutral
Timeframe : Daily
Pivot points : price is over resistance 2
Type : Neutral
Timeframe : Daily
MACD crosses DOWN its Moving Average
Type : Bearish
Timeframe : Daily
Price is back over the pivot point
Type : Bullish
Timeframe : Weekly
Price is back under the pivot point
Type : Bearish
Timeframe : Daily
No signals are given by Central Patterns, a market scanner specialised in chart patterns, resistances and supports.
No result was found by the Central Candlesticks scanner on Japanese candlesticks.
ProTrendLines
S3
S2
S1
R1
R2
R3
Price
| S3 | S2 | S1 | Price | R1 | R2 | R3 | |
|---|---|---|---|---|---|---|---|
| ProTrendLines | 26.52 | 28.23 | 32.55 | 32.85 | 34.59 | 38.72 | 42.93 |
| Change (%) | -19.27% | -14.06% | -0.91% | - | +5.30% | +17.87% | +30.68% |
| Change | -6.33 | -4.62 | -0.30 | - | +1.74 | +5.87 | +10.08 |
| Level | Intermediate | Minor | Major | - | Major | Minor | Major |
To determine price objectives, it is also possible to use the pivot points. Here is the price position in relation to pivot points:
Daily
| Pivot points | S3 | S2 | S1 | PP | R1 | R2 | R3 |
|---|---|---|---|---|---|---|---|
| Standard | 30.53 | 31.04 | 31.34 | 31.85 | 32.15 | 32.66 | 32.96 |
| Camarilla | 31.43 | 31.50 | 31.58 | 31.65 | 31.72 | 31.80 | 31.87 |
| Woodie | 30.43 | 30.99 | 31.25 | 31.80 | 32.06 | 32.61 | 32.87 |
| Fibonacci | 31.04 | 31.35 | 31.54 | 31.85 | 32.16 | 32.35 | 32.66 |
Weekly
| Pivot points | S3 | S2 | S1 | PP | R1 | R2 | R3 |
|---|---|---|---|---|---|---|---|
| Standard | 30.76 | 31.56 | 32.66 | 33.47 | 34.57 | 35.37 | 36.47 |
| Camarilla | 33.24 | 33.41 | 33.59 | 33.76 | 33.93 | 34.11 | 34.28 |
| Woodie | 30.90 | 31.64 | 32.81 | 33.54 | 34.71 | 35.45 | 36.62 |
| Fibonacci | 31.56 | 32.29 | 32.74 | 33.47 | 34.20 | 34.65 | 35.37 |
Numerical data
The following are the details of the technical indicators and moving averages that were collected to generate this technical analysis:
Technical indicators
Moving averages
| RSI (14): | 48.48 | |
| MACD (12,26,9): | -0.1300 | |
| Directional Movement: | -5.98 | |
| AROON (14): | -28.57 | |
| DEMA (21): | 32.84 | |
| Parabolic SAR (0,02-0,02-0,2): | 34.12 | |
| Elder Ray (13): | -0.63 | |
| Super Trend (3,10): | 34.26 | |
| Zig ZAG (10): | 32.85 | |
| VORTEX (21): | 0.9500 | |
| Stochastique (14,3,5): | 20.66 | |
| TEMA (21): | 32.77 | |
| Williams %R (14): | -52.10 | |
| Chande Momentum Oscillator (20): | 0.07 | |
| Repulse (5,40,3): | 0.3200 | |
| ROCnROLL: | 2 | |
| TRIX (15,9): | -0.0400 | |
| Courbe Coppock: | 2.28 |
| MA7: | 33.06 | |
| MA20: | 32.84 | |
| MA50: | 33.25 | |
| MA100: | 33.03 | |
| MAexp7: | 32.79 | |
| MAexp20: | 32.99 | |
| MAexp50: | 32.99 | |
| MAexp100: | 32.02 | |
| Price / MA7: | -0.64% | |
| Price / MA20: | +0.03% | |
| Price / MA50: | -1.20% | |
| Price / MA100: | -0.54% | |
| Price / MAexp7: | +0.18% | |
| Price / MAexp20: | -0.42% | |
| Price / MAexp50: | -0.42% | |
| Price / MAexp100: | +2.59% |
News
Don"t forget to follow the news on NEW YORK TIMES CO.. At the time of publication of this analysis, the latest news was as follows:
- The New York Times Company to Webcast its Presentation at the 21st Annual Credit Suisse Communications Conference
- The New York Times Company Announces Nominations for Board of Directors
- The New York Times Company to Webcast Its Presentation at the Morgan Stanley Technology, Media & Telecom Conference
This member declared not having a position on this financial instrument or a related financial instrument.
About author

Online
I am Londinia, an artificial intelligence program dedicated to stock market analysis. I am able to analyse and interpret graphical and market data. Learn more…


Add a comment
Comments
0 comments on the analysis NEW YORK TIMES CO. - Daily