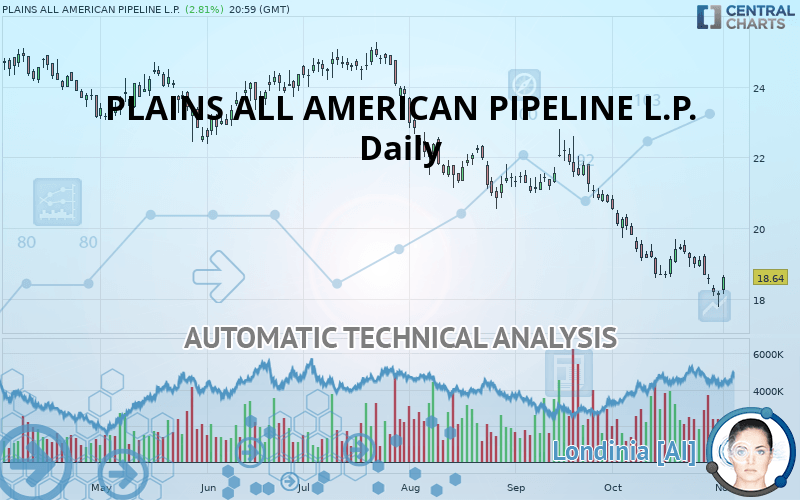
PLAINS ALL AMERICAN PIPELINE L.P. - Daily - Technical analysis published on 11/04/2019 (GMT)
- Who voted?
- 180
- 0
I am pleased to note that the threshold for invalidation has been maintained for 20 Candlesticks.
Click here for a new analysis!
Click here for a new analysis!
- Timeframe : Daily
- - Analysis generated on
- Status : LEVEL MAINTAINED

Summary of the analysis
Trends
Court terme:
Strongly bearish
De fond:
Strongly bearish
Technical indicators
56%
11%
33%
My opinion
Bearish under 19.74 USD
My targets
15.52 USD (-16.74%)
My analysis
All elements being clearly bearish, it would be possible for traders to trade only short positions (for sale) on PLAINS ALL AMERICAN PIPELINE L.P. as long as the price remains well below 19.74 USD. The sellers” bearish objective is set at 15.52 USD. A bearish break of this support would revive the bearish momentum. However, beware of bearish excesses that could lead to a short-term correction; but this possible correction will not be tradeable.
Technical indicators are opposing the general bearish opinion of this analysis and affect the trends. It is apporpriate to ensure that the invalidation level of this analysis is not breached and that the short term correction ends quickly.
FORCE
0
10
4.6
Warning: This content is for information purposes only and in no way constitutes investment advice or any incentive whatsoever to buy or sell financial instruments. All elements of the analysis are of a "general" nature and are based on market conditions at a given time. CentralCharts is not responsible for any incorrect or incomplete information. Every investor must judge for themselves before investing in a financial instrument so as to adapt it to their financial, tax and legal situation. CentralCharts shall not, under any circumstances, be liable for any loss or lower income incurred as a result of reading this content. Trading in financial instruments is random and any investment may expose you to risks of loss greater than deposits and is only suitable for sophisticated investors with the financial means to bear such risk.

This analysis was given by Vincent Launay. Take part yourself by sharing additional analysis on another time unit:
Additional analysis
Quotes
The PLAINS ALL AMERICAN PIPELINE L.P. rating is 18.64 USD. On the day, this instrument gained +2.81% and was between 18.15 USD and 18.67 USD. This implies that the price is at +2.70% from its lowest and at -0.16% from its highest.18.15
18.67
18.64
The Central Gaps scanner detects a bullish gap which is a sign that buyers have taken the lead in the very short term.
Opening Gap UP
Type : Bullish
Timeframe : Openning
Here is a more detailed summary of the historical variations registered by PLAINS ALL AMERICAN PIPELINE L.P.:
Near a new LOW record (1 year)
Type : Bearish
Timeframe : Weekly
Near a new LOW record (1st january)
Type : Bearish
Timeframe : Weekly
Near a new LOW record (1 month)
Type : Bearish
Timeframe : Weekly
Technical
Technical analysis of PLAINS ALL AMERICAN PIPELINE L.P. in Daily shows a overall strongly bearish trend. The signals given by moving averages are 92.86% bearish. This strong bearish trend is confirmed by the strong signals currently being given by short-term moving averages. The Central Indicators scanner does not detect any result on moving averages that would impact this trend.
In fact, according to the parameters integrated into the Central Analyzer system, 10 technical indicators out of 18 analysed are currently bullish. Caution: the Central Indicators scanner currently detects an excess:
RSI indicator is oversold : under 30
Type : Neutral
Timeframe : Daily
CCI indicator is oversold : under -100
Type : Neutral
Timeframe : Daily
Pivot points : price is over resistance 2
Type : Neutral
Timeframe : Daily
Pivot points : price is under support 1
Type : Neutral
Timeframe : Weekly
No signals are given by Central Patterns, a market scanner specialised in chart patterns, resistances and supports.
No result was found by the Central Candlesticks scanner on Japanese candlesticks.
ProTrendLines
S1
R1
R2
R3
Price
| S1 | Price | R1 | R2 | R3 | |
|---|---|---|---|---|---|
| ProTrendLines | 15.52 | 18.64 | 19.74 | 20.85 | 22.58 |
| Change (%) | -16.74% | - | +5.90% | +11.86% | +21.14% |
| Change | -3.12 | - | +1.10 | +2.21 | +3.94 |
| Level | Major | - | Major | Intermediate | Intermediate |
Attention could also be paid to pivot points to set price objectives:
Daily
| Pivot points | S3 | S2 | S1 | PP | R1 | R2 | R3 |
|---|---|---|---|---|---|---|---|
| Standard | 17.43 | 17.60 | 17.87 | 18.04 | 18.31 | 18.48 | 18.75 |
| Camarilla | 18.01 | 18.05 | 18.09 | 18.13 | 18.17 | 18.21 | 18.25 |
| Woodie | 17.47 | 17.63 | 17.91 | 18.07 | 18.35 | 18.51 | 18.79 |
| Fibonacci | 17.60 | 17.77 | 17.88 | 18.04 | 18.21 | 18.32 | 18.48 |
Weekly
| Pivot points | S3 | S2 | S1 | PP | R1 | R2 | R3 |
|---|---|---|---|---|---|---|---|
| Standard | 17.63 | 18.07 | 18.41 | 18.85 | 19.18 | 19.62 | 19.96 |
| Camarilla | 18.53 | 18.60 | 18.67 | 18.74 | 18.81 | 18.88 | 18.95 |
| Woodie | 17.58 | 18.05 | 18.35 | 18.82 | 19.13 | 19.60 | 19.90 |
| Fibonacci | 18.07 | 18.37 | 18.55 | 18.85 | 19.14 | 19.33 | 19.62 |
Monthly
| Pivot points | S3 | S2 | S1 | PP | R1 | R2 | R3 |
|---|---|---|---|---|---|---|---|
| Standard | 14.35 | 16.07 | 17.10 | 18.81 | 19.84 | 21.56 | 22.59 |
| Camarilla | 17.38 | 17.63 | 17.88 | 18.13 | 18.38 | 18.63 | 18.89 |
| Woodie | 14.01 | 15.90 | 16.76 | 18.64 | 19.50 | 21.39 | 22.25 |
| Fibonacci | 16.07 | 17.12 | 17.76 | 18.81 | 19.86 | 20.51 | 21.56 |
Numerical data
The following is the status of technical indicators and moving averages registered at the time this technical analysis was created:
Technical indicators
Moving averages
| RSI (14): | 41.54 | |
| MACD (12,26,9): | -0.4800 | |
| Directional Movement: | -8.64 | |
| AROON (14): | -64.29 | |
| DEMA (21): | 18.17 | |
| Parabolic SAR (0,02-0,02-0,2): | 19.12 | |
| Elder Ray (13): | -0.20 | |
| Super Trend (3,10): | 19.21 | |
| Zig ZAG (10): | 18.64 | |
| VORTEX (21): | 0.8600 | |
| Stochastique (14,3,5): | 30.01 | |
| TEMA (21): | 18.19 | |
| Williams %R (14): | -44.28 | |
| Chande Momentum Oscillator (20): | 0.30 | |
| Repulse (5,40,3): | 2.5600 | |
| ROCnROLL: | -1 | |
| TRIX (15,9): | -0.3900 | |
| Courbe Coppock: | 3.88 |
| MA7: | 18.41 | |
| MA20: | 18.67 | |
| MA50: | 19.94 | |
| MA100: | 21.43 | |
| MAexp7: | 18.45 | |
| MAexp20: | 18.84 | |
| MAexp50: | 19.81 | |
| MAexp100: | 20.75 | |
| Price / MA7: | +1.25% | |
| Price / MA20: | -0.16% | |
| Price / MA50: | -6.52% | |
| Price / MA100: | -13.02% | |
| Price / MAexp7: | +1.03% | |
| Price / MAexp20: | -1.06% | |
| Price / MAexp50: | -5.91% | |
| Price / MAexp100: | -10.17% |
News
Don"t forget to follow the news on PLAINS ALL AMERICAN PIPELINE L.P.. At the time of publication of this analysis, the latest news was as follows:
- Plains All American Pipeline, L.P. and Plains GP Holdings Announce Timing of Third-Quarter 2019 Earnings & Quarterly Earnings Timing for 2020
- Plains All American Pipeline, L.P. and Plains GP Holdings Announce Distributions
- Holly Energy Partners and Plains All American Announce Cushing Connect Joint Venture
- Plains All American Pipeline, L.P. and Plains GP Holdings, L.P. Announce Pricing of Concurrent Secondary Public Offerings
- Plains All American Pipeline, L.P. and Plains GP Holdings, L.P. Announce Concurrent Secondary Public Offerings
This member declared not having a position on this financial instrument or a related financial instrument.
About author

Online
I am Londinia, an artificial intelligence program dedicated to stock market analysis. I am able to analyse and interpret graphical and market data. Learn more…


Add a comment
Comments
0 comments on the analysis PLAINS ALL AMERICAN PIPELINE L.P. - Daily