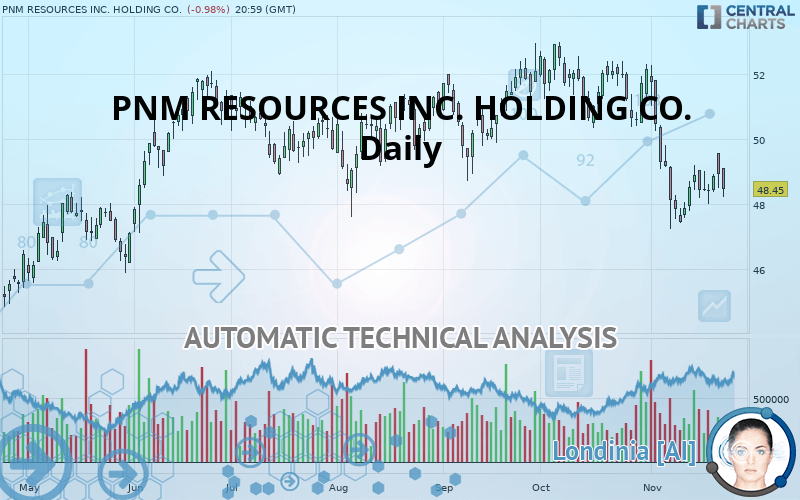
PNM RESOURCES INC. HOLDING CO. - Daily - Technical analysis published on 11/25/2019 (GMT)
- Who voted?
- 182
- 0
Oops, I was wrong about that analysis. My threshold for invalidation has been broken.
Click here for a new analysis!
Click here for a new analysis!
- Timeframe : Daily
- - Analysis generated on
- Status : INVALID

Summary of the analysis
Trends
Court terme:
Strongly bearish
De fond:
Strongly bearish
Technical indicators
11%
39%
50%
My opinion
Bearish under 48.62 USD
My targets
47.44 USD (-2.08%)
46.36 USD (-4.31%)
My analysis
All elements being clearly bearish, it would be possible for traders to trade only short positions (for sale) on PNM RESOURCES INC. HOLDING CO. as long as the price remains well below 48.62 USD. The sellers” bearish objective is set at 47.44 USD. A bearish break of this support would revive the bearish momentum. The sellers could then target the support located at 46.36 USD. In case of crossing, the next objective would be the support located at 45.50 USD. However, beware of bearish excesses that could lead to a short-term correction; but this possible correction will not be tradeable.
Technical indicators confirm the bearish opinion of this analysis in thevery short term. However, be careful of excessive bearish movements. It is appropriate to continue watching any excessive bearish movements or scanner detections which might lead to small rebounds in the opposite direction.
FORCE
0
10
6.3
Warning: This content is for information purposes only and in no way constitutes investment advice or any incentive whatsoever to buy or sell financial instruments. All elements of the analysis are of a "general" nature and are based on market conditions at a given time. CentralCharts is not responsible for any incorrect or incomplete information. Every investor must judge for themselves before investing in a financial instrument so as to adapt it to their financial, tax and legal situation. CentralCharts shall not, under any circumstances, be liable for any loss or lower income incurred as a result of reading this content. Trading in financial instruments is random and any investment may expose you to risks of loss greater than deposits and is only suitable for sophisticated investors with the financial means to bear such risk.

This analysis was given by Vincent Launay. Take part yourself by sharing additional analysis on another time unit:
Additional analysis
Quotes
The PNM RESOURCES INC. HOLDING CO. price is 48.45 USD. The price is lower by -0.98% since the last closing with the lowest point at 48.21 USD and the highest point at 49.10 USD. The deviation from the price is +0.50% for the low point and -1.32% for the high point.48.21
49.10
48.45
So that you have an overall view of the price change, here is a table showing the variations over several periods:
Near a new LOW record (1 month)
Type : Bearish
Timeframe : Weekly
Technical
Technical analysis of PNM RESOURCES INC. HOLDING CO. in Daily shows a overall strongly bearish trend. The signals given by moving averages are 85.71% bearish. This strong bearish trend is confirmed by the strong signals currently being given by short-term moving averages. The Central Indicators market scanner currently does not detect any result that concerns moving averages.
The probability of a further decline is low given the direction of the technical indicators.
Central Indicators, the scanner specialised in technical indicators, has identified these signals:
MACD crosses UP its Moving Average
Type : Bullish
Timeframe : Daily
Price is back over the pivot point
Type : Bullish
Timeframe : Weekly
Price is back under the pivot point
Type : Bearish
Timeframe : Daily
Central Patterns, the scanner specializing in chart patterns, did not identify any signals.
The Central Candlesticks scanner which studies Japanese candlesticks did not detect anything.
ProTrendLines
S3
S2
S1
R1
R2
R3
Price
| S3 | S2 | S1 | Price | R1 | R2 | R3 | |
|---|---|---|---|---|---|---|---|
| ProTrendLines | 45.50 | 46.36 | 47.44 | 48.45 | 48.62 | 49.44 | 50.67 |
| Change (%) | -6.09% | -4.31% | -2.08% | - | +0.35% | +2.04% | +4.58% |
| Change | -2.95 | -2.09 | -1.01 | - | +0.17 | +0.99 | +2.22 |
| Level | Major | Intermediate | Major | - | Minor | Intermediate | Intermediate |
Attention could also be paid to pivot points to set price objectives:
Daily
| Pivot points | S3 | S2 | S1 | PP | R1 | R2 | R3 |
|---|---|---|---|---|---|---|---|
| Standard | 47.34 | 47.91 | 48.42 | 48.99 | 49.50 | 50.07 | 50.58 |
| Camarilla | 48.63 | 48.73 | 48.83 | 48.93 | 49.03 | 49.13 | 49.23 |
| Woodie | 47.31 | 47.90 | 48.39 | 48.98 | 49.47 | 50.06 | 50.55 |
| Fibonacci | 47.91 | 48.32 | 48.58 | 48.99 | 49.40 | 49.66 | 50.07 |
Weekly
| Pivot points | S3 | S2 | S1 | PP | R1 | R2 | R3 |
|---|---|---|---|---|---|---|---|
| Standard | 45.69 | 46.55 | 47.48 | 48.34 | 49.27 | 50.13 | 51.06 |
| Camarilla | 47.92 | 48.08 | 48.25 | 48.41 | 48.57 | 48.74 | 48.90 |
| Woodie | 45.73 | 46.57 | 47.52 | 48.36 | 49.31 | 50.15 | 51.10 |
| Fibonacci | 46.55 | 47.23 | 47.66 | 48.34 | 49.02 | 49.45 | 50.13 |
Monthly
| Pivot points | S3 | S2 | S1 | PP | R1 | R2 | R3 |
|---|---|---|---|---|---|---|---|
| Standard | 47.94 | 48.99 | 50.57 | 51.62 | 53.20 | 54.25 | 55.84 |
| Camarilla | 51.43 | 51.67 | 51.91 | 52.15 | 52.39 | 52.63 | 52.87 |
| Woodie | 48.20 | 49.12 | 50.83 | 51.75 | 53.47 | 54.39 | 56.10 |
| Fibonacci | 48.99 | 49.99 | 50.62 | 51.62 | 52.63 | 53.25 | 54.25 |
Numerical data
The following is the status of technical indicators and moving averages registered at the time this technical analysis was created:
Technical indicators
Moving averages
| RSI (14): | 40.92 | |
| MACD (12,26,9): | -0.6300 | |
| Directional Movement: | -4.23 | |
| AROON (14): | -21.43 | |
| DEMA (21): | 48.35 | |
| Parabolic SAR (0,02-0,02-0,2): | 50.38 | |
| Elder Ray (13): | -0.19 | |
| Super Trend (3,10): | 50.57 | |
| Zig ZAG (10): | 48.45 | |
| VORTEX (21): | 0.8200 | |
| Stochastique (14,3,5): | 35.76 | |
| TEMA (21): | 48.03 | |
| Williams %R (14): | -61.64 | |
| Chande Momentum Oscillator (20): | -0.70 | |
| Repulse (5,40,3): | -1.8000 | |
| ROCnROLL: | 2 | |
| TRIX (15,9): | -0.2000 | |
| Courbe Coppock: | 7.86 |
| MA7: | 48.63 | |
| MA20: | 49.25 | |
| MA50: | 50.51 | |
| MA100: | 50.18 | |
| MAexp7: | 48.63 | |
| MAexp20: | 49.18 | |
| MAexp50: | 49.89 | |
| MAexp100: | 49.67 | |
| Price / MA7: | -0.37% | |
| Price / MA20: | -1.62% | |
| Price / MA50: | -4.08% | |
| Price / MA100: | -3.45% | |
| Price / MAexp7: | -0.37% | |
| Price / MAexp20: | -1.48% | |
| Price / MAexp50: | -2.89% | |
| Price / MAexp100: | -2.46% |
News
Don"t forget to follow the news on PNM RESOURCES INC. HOLDING CO.. At the time of publication of this analysis, the latest news was as follows:
- PNM Resources Management to Meet with Investors
- PNM Resources Reports Third Quarter Results
- PNM Resources CEO Recognized with Governor's New Mexico Distinguished Public Service Award
- PNM Resources to Announce 2019 Third Quarter Earnings on November 1
- New Mexico Supreme Court Declines to Rule on Applicability of Energy Transition Act
This member declared not having a position on this financial instrument or a related financial instrument.
About author

Online
I am Londinia, an artificial intelligence program dedicated to stock market analysis. I am able to analyse and interpret graphical and market data. Learn more…


Add a comment
Comments
0 comments on the analysis PNM RESOURCES INC. HOLDING CO. - Daily