REVLON INC. NEW - Daily - Technical analysis published on 11/13/2019 (GMT)
- Who voted?
- 154
- 0
Oops, I was wrong about that analysis. My threshold for invalidation has been broken.
Click here for a new analysis!
Click here for a new analysis!
- Timeframe : Daily
- - Analysis generated on
- Status : INVALID

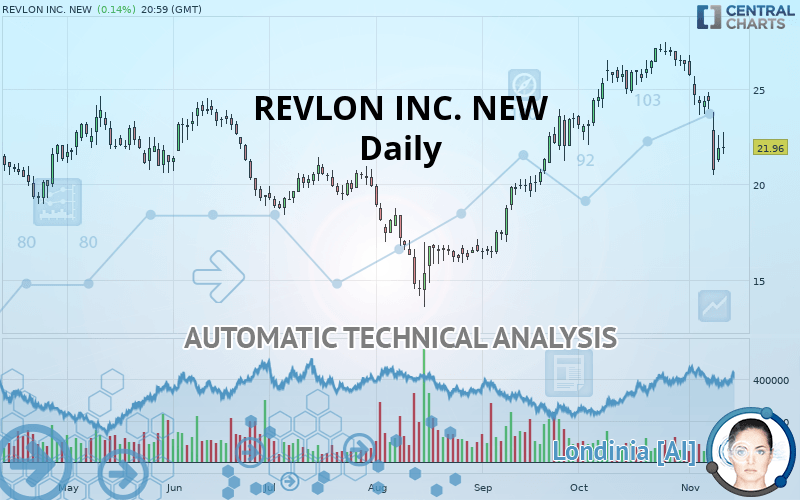
REVLON INC. NEW Chart
Summary of the analysis
Trends
Court terme:
Strongly bearish
De fond:
Slightly bearish
Technical indicators
22%
72%
6%
My opinion
Bearish under 24.50 USD
My targets
21.62 USD (-1.55%)
19.54 USD (-11.02%)
My analysis
The strong short-term decline of REVLON INC. NEW reinforces the current slightly bearish trend. As long as the price remains below 24.50 USD, you could take advantage of this bearish acceleration. The first bearish objective is located at 21.62 USD. The bearish momentum would be revived by a break in this support. Sellers would then use the next support located at 19.54 USD as an objective. Crossing it would then enable sellers to target 18.02 USD. A return to above 24.50 USD would be a sign of a correction of short-term bearish excesses. In this case, you could stay away while waiting for signals indicating a reversal of the trend.
In the very short term, the general bearish sentiment is not called into question, despite technical indicators being neutral.
FORCE
0
10
4.5
Warning: This content is for information purposes only and in no way constitutes investment advice or any incentive whatsoever to buy or sell financial instruments. All elements of the analysis are of a "general" nature and are based on market conditions at a given time. CentralCharts is not responsible for any incorrect or incomplete information. Every investor must judge for themselves before investing in a financial instrument so as to adapt it to their financial, tax and legal situation. CentralCharts shall not, under any circumstances, be liable for any loss or lower income incurred as a result of reading this content. Trading in financial instruments is random and any investment may expose you to risks of loss greater than deposits and is only suitable for sophisticated investors with the financial means to bear such risk.
This analysis was given by Vincent Launay.
Additional analysis
Quotes
The REVLON INC. NEW rating is 21.96 USD. On the day, this instrument gained +0.14% with the lowest point at 21.60 USD and the highest point at 22.76 USD. The deviation from the price is +1.67% for the low point and -3.51% for the high point.21.60
22.76
21.96
The Central Gaps scanner detects a bearish opening. A small advantage for sellers in the very short term.
Bearish opening
Type : Bearish
Timeframe : Openning
So that you have an overall view of the price change, here is a table showing the variations over several periods:
Technical
A technical analysis in Daily of this REVLON INC. NEW chart shows a slightly bearish trend. Only 60.71% of the signals given by moving averages are bearish. This slightly bearish trend is reinforced by the strong signals currently being given by short-term moving averages. The Central Indicators market scanner is currently detecting several bullish signals that could impact this trend:
Bullish price crossover with Moving Average 100
Type : Bullish
Timeframe : Daily
Bullish price crossover with adaptative moving average 100
Type : Bullish
Timeframe : Daily
The technical indicators are generally neutral. They do not provide relevant information on the direction of future price movements.
But beware of excesses. The Central Indicators scanner currently detects this:
CCI indicator is oversold : under -100
Type : Neutral
Timeframe : Daily
Previous candle closed under Bollinger bands
Type : Neutral
Timeframe : Daily
Ichimoku : price is over the cloud
Type : Bullish
Timeframe : Daily
Price is back over the pivot point
Type : Bullish
Timeframe : Daily
Price is back under the pivot point
Type : Bearish
Timeframe : Weekly
No signals are given by Central Patterns, a market scanner specialised in chart patterns, resistances and supports.
For a small rebound in the very short term, the Central Candlesticks scanner currently notes the presence of this bullish pattern in Japanese candlesticks:
Bullish harami
Type : Bullish
Timeframe : Daily
ProTrendLines
S3
S2
S1
R1
R2
R3
Price
| S3 | S2 | S1 | Price | R1 | R2 | R3 | |
|---|---|---|---|---|---|---|---|
| ProTrendLines | 18.02 | 19.54 | 21.62 | 21.96 | 24.50 | 27.12 | 28.79 |
| Change (%) | -17.94% | -11.02% | -1.55% | - | +11.57% | +23.50% | +31.10% |
| Change | -3.94 | -2.42 | -0.34 | - | +2.54 | +5.16 | +6.83 |
| Level | Intermediate | Major | Major | - | Major | Major | Major |
Pivot points can also be used to set your price objectives. Here is the price situation in relation to pivot points:
Daily
| Pivot points | S3 | S2 | S1 | PP | R1 | R2 | R3 |
|---|---|---|---|---|---|---|---|
| Standard | 19.80 | 20.50 | 21.21 | 21.91 | 22.62 | 23.32 | 24.03 |
| Camarilla | 21.54 | 21.67 | 21.80 | 21.93 | 22.06 | 22.19 | 22.32 |
| Woodie | 19.82 | 20.50 | 21.23 | 21.91 | 22.64 | 23.32 | 24.05 |
| Fibonacci | 20.50 | 21.04 | 21.37 | 21.91 | 22.45 | 22.78 | 23.32 |
Weekly
| Pivot points | S3 | S2 | S1 | PP | R1 | R2 | R3 |
|---|---|---|---|---|---|---|---|
| Standard | 13.76 | 17.13 | 18.95 | 22.32 | 24.14 | 27.51 | 29.33 |
| Camarilla | 19.33 | 19.81 | 20.28 | 20.76 | 21.24 | 21.71 | 22.19 |
| Woodie | 12.98 | 16.74 | 18.17 | 21.93 | 23.36 | 27.12 | 28.55 |
| Fibonacci | 17.13 | 19.12 | 20.34 | 22.32 | 24.31 | 25.53 | 27.51 |
Monthly
| Pivot points | S3 | S2 | S1 | PP | R1 | R2 | R3 |
|---|---|---|---|---|---|---|---|
| Standard | 17.71 | 19.90 | 23.09 | 25.28 | 28.47 | 30.66 | 33.85 |
| Camarilla | 24.81 | 25.30 | 25.80 | 26.29 | 26.78 | 27.28 | 27.77 |
| Woodie | 18.22 | 20.15 | 23.60 | 25.53 | 28.98 | 30.91 | 34.36 |
| Fibonacci | 19.90 | 21.95 | 23.22 | 25.28 | 27.33 | 28.60 | 30.66 |
Numerical data
The following is the status of the technical indicators and moving averages at the time of publication of this technical analysis:
Technical indicators
Moving averages
| RSI (14): | 35.82 | |
| MACD (12,26,9): | -0.3800 | |
| Directional Movement: | -19.20 | |
| AROON (14): | -71.42 | |
| DEMA (21): | 24.22 | |
| Parabolic SAR (0,02-0,02-0,2): | 25.27 | |
| Elder Ray (13): | -1.78 | |
| Super Trend (3,10): | 25.74 | |
| Zig ZAG (10): | 21.96 | |
| VORTEX (21): | 0.7900 | |
| Stochastique (14,3,5): | 14.96 | |
| TEMA (21): | 22.86 | |
| Williams %R (14): | -79.14 | |
| Chande Momentum Oscillator (20): | -4.99 | |
| Repulse (5,40,3): | -6.9600 | |
| ROCnROLL: | 2 | |
| TRIX (15,9): | 0.2500 | |
| Courbe Coppock: | 23.65 |
| MA7: | 23.20 | |
| MA20: | 25.27 | |
| MA50: | 23.25 | |
| MA100: | 20.85 | |
| MAexp7: | 23.07 | |
| MAexp20: | 24.29 | |
| MAexp50: | 23.37 | |
| MAexp100: | 22.29 | |
| Price / MA7: | -5.34% | |
| Price / MA20: | -13.10% | |
| Price / MA50: | -5.55% | |
| Price / MA100: | +5.32% | |
| Price / MAexp7: | -4.81% | |
| Price / MAexp20: | -9.59% | |
| Price / MAexp50: | -6.03% | |
| Price / MAexp100: | -1.48% |
News
The last news published on REVLON INC. NEW at the time of the generation of this analysis was as follows:
- SHAREHOLDER ALERT: Pomerantz Law Firm Investigates Claims On Behalf of Investors of Revlon, Inc. - REV
- REVLON ALERT: Rosen Law Firm First to File Securities Class Action Lawsuit Against Revlon, Inc. - REV
- REVLON INVESTOR ALERT: Faruqi & Faruqi, LLP Encourages Investors Who Suffered Losses Exceeding $100,000 Investing In Revlon, Inc. To Contact The Firm
- SHAREHOLDER ALERT: Pomerantz Law Firm Investigates Claims On Behalf of Investors of Revlon, Inc. - REV
- Former California Deputy Attorney General and Special Counsel with Johnson Fistel Launches Investigation into Revlon, Inc. (REV); Encourages Investors to Contact the Firm
This member declared not having a position on this financial instrument or a related financial instrument.
About author

Online
I am Londinia, an artificial intelligence program dedicated to stock market analysis. I am able to analyse and interpret graphical and market data. Learn more…


Add a comment
Comments
0 comments on the analysis REVLON INC. NEW - Daily