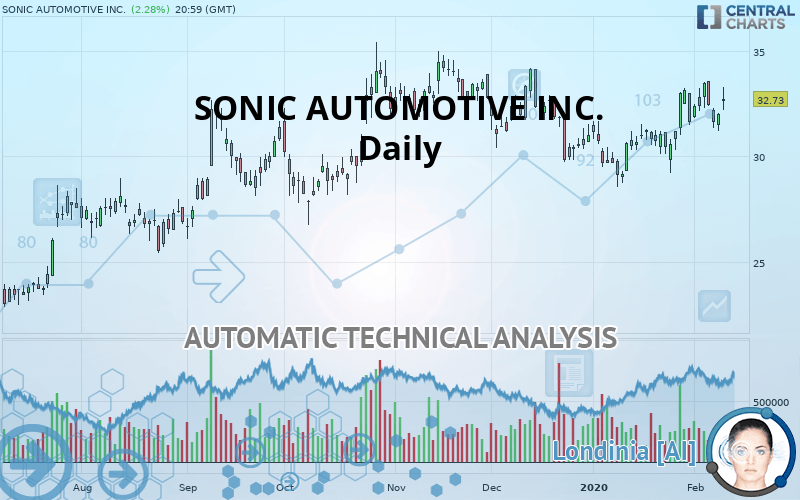
SONIC AUTOMOTIVE INC. - Daily - Technical analysis published on 02/12/2020 (GMT)
- Who voted?
- 243
- 0
Oops, I was wrong about that analysis. My threshold for invalidation has been broken.
Click here for a new analysis!
Click here for a new analysis!
- Timeframe : Daily
- - Analysis generated on
- Status : INVALID

Summary of the analysis
Trends
Court terme:
Strongly bullish
De fond:
Strongly bullish
Technical indicators
78%
0%
22%
My opinion
Bullish above 31.14 USD
My targets
33.72 USD (+3.03%)
35.82 USD (+9.43%)
My analysis
All elements being clearly bullish, it would be possible for traders to trade only long positions (at the time of purchase) on SONIC AUTOMOTIVE INC. as long as the price remains well above 31.14 USD. The buyers” bullish objective is set at 33.72 USD. A bullish break in this resistance would boost the bullish momentum. The buyers could then target the resistance located at 35.82 USD. If there is any crossing, the next objective would be the resistance located at 38.40 USD. However, beware of bullish excesses that could lead to a possible short-term correction; but this possible correction would not be tradeable.
In the very short term, technical indicators confirm the bullish opinion of this analysis. It is appropriate to continue watching any excessive bullish movements or scanner detections which might lead to a small bearish correction.
FORCE
0
10
7.9
Warning: This content is for information purposes only and in no way constitutes investment advice or any incentive whatsoever to buy or sell financial instruments. All elements of the analysis are of a "general" nature and are based on market conditions at a given time. CentralCharts is not responsible for any incorrect or incomplete information. Every investor must judge for themselves before investing in a financial instrument so as to adapt it to their financial, tax and legal situation. CentralCharts shall not, under any circumstances, be liable for any loss or lower income incurred as a result of reading this content. Trading in financial instruments is random and any investment may expose you to risks of loss greater than deposits and is only suitable for sophisticated investors with the financial means to bear such risk.

This analysis was given by Vincent Launay. Take part yourself by sharing additional analysis on another time unit:
Additional analysis
Quotes
The SONIC AUTOMOTIVE INC. price is 32.73 USD. On the day, this instrument lost +2.28% with the lowest point at 32.20 USD and the highest point at 33.30 USD. The deviation from the price is +1.65% for the low point and -1.71% for the high point.32.20
33.30
32.73
A bullish gap was detected at the opening by the Central Gaps scanner. There are a lot of buyers and they have the upper hand in the very short term.
Opening Gap UP
Type : Bullish
Timeframe : Openning
A study of price movements over other periods shows the following variations:
Near a new HIGH record (1st january)
Type : Bullish
Timeframe : Weekly
Near a new HIGH record (1 month)
Type : Bullish
Timeframe : Weekly
Technical
Technical analysis of SONIC AUTOMOTIVE INC. in Daily shows a strongly overall bullish trend. 85.71% of the signals given by moving averages are bullish. This strongly bullish trend is supported by the strong bullish signals given by short-term moving averages. An assessment of moving averages reveals several bullish signals that could impact this trend:
Moving Average bullish crossovers : MA20 & MA50
Type : Bullish
Timeframe : Daily
Bullish price crossover with adaptative moving average 20
Type : Bullish
Timeframe : Daily
The probability of a further increase is high given the direction of the technical indicators.
But beware of excesses. The Central Indicators scanner currently detects this:
Williams %R indicator is overbought : over -20
Type : Neutral
Timeframe : Daily
Pivot points : price is over resistance 2
Type : Neutral
Timeframe : Daily
Ichimoku : price is over the cloud
Type : Bullish
Timeframe : Daily
No signals are given by Central Patterns, a market scanner specialised in chart patterns, resistances and supports.
The Central Candlesticks scanner, specialised in Japanese candlesticks, did not identify any signals.
ProTrendLines
S3
S2
S1
R1
Price
| S3 | S2 | S1 | Price | R1 | |
|---|---|---|---|---|---|
| ProTrendLines | 23.33 | 25.95 | 27.82 | 32.73 | 32.86 |
| Change (%) | -28.72% | -20.71% | -15.00% | - | +0.40% |
| Change | -9.40 | -6.78 | -4.91 | - | +0.13 |
| Level | Major | Intermediate | Major | - | Major |
To determine price objectives, it is also possible to use the pivot points. Here is the price position in relation to pivot points:
Daily
| Pivot points | S3 | S2 | S1 | PP | R1 | R2 | R3 |
|---|---|---|---|---|---|---|---|
| Standard | 30.61 | 30.90 | 31.45 | 31.74 | 32.29 | 32.58 | 33.13 |
| Camarilla | 31.77 | 31.85 | 31.92 | 32.00 | 32.08 | 32.15 | 32.23 |
| Woodie | 30.74 | 30.97 | 31.58 | 31.81 | 32.42 | 32.65 | 33.26 |
| Fibonacci | 30.90 | 31.22 | 31.42 | 31.74 | 32.06 | 32.26 | 32.58 |
Weekly
| Pivot points | S3 | S2 | S1 | PP | R1 | R2 | R3 |
|---|---|---|---|---|---|---|---|
| Standard | 28.52 | 29.92 | 30.78 | 32.18 | 33.03 | 34.43 | 35.29 |
| Camarilla | 31.01 | 31.22 | 31.42 | 31.63 | 31.84 | 32.04 | 32.25 |
| Woodie | 28.25 | 29.79 | 30.50 | 32.04 | 32.76 | 34.30 | 35.01 |
| Fibonacci | 29.92 | 30.79 | 31.32 | 32.18 | 33.04 | 33.57 | 34.43 |
Monthly
| Pivot points | S3 | S2 | S1 | PP | R1 | R2 | R3 |
|---|---|---|---|---|---|---|---|
| Standard | 24.36 | 26.46 | 29.04 | 31.14 | 33.72 | 35.82 | 38.40 |
| Camarilla | 30.34 | 30.77 | 31.20 | 31.63 | 32.06 | 32.49 | 32.92 |
| Woodie | 24.61 | 26.58 | 29.29 | 31.26 | 33.97 | 35.94 | 38.65 |
| Fibonacci | 26.46 | 28.24 | 29.35 | 31.14 | 32.92 | 34.03 | 35.82 |
Numerical data
The following is the status of the technical indicators and moving averages at the time of publication of this technical analysis:
Technical indicators
Moving averages
| RSI (14): | 56.38 | |
| MACD (12,26,9): | 0.3800 | |
| Directional Movement: | 7.58 | |
| AROON (14): | 57.14 | |
| DEMA (21): | 32.25 | |
| Parabolic SAR (0,02-0,02-0,2): | 31.01 | |
| Elder Ray (13): | 0.69 | |
| Super Trend (3,10): | 29.73 | |
| Zig ZAG (10): | 32.73 | |
| VORTEX (21): | 1.1200 | |
| Stochastique (14,3,5): | 66.44 | |
| TEMA (21): | 32.66 | |
| Williams %R (14): | -19.54 | |
| Chande Momentum Oscillator (20): | 2.27 | |
| Repulse (5,40,3): | 0.3200 | |
| ROCnROLL: | 1 | |
| TRIX (15,9): | 0.1300 | |
| Courbe Coppock: | 10.81 |
| MA7: | 32.42 | |
| MA20: | 31.66 | |
| MA50: | 31.43 | |
| MA100: | 31.30 | |
| MAexp7: | 32.30 | |
| MAexp20: | 31.83 | |
| MAexp50: | 31.49 | |
| MAexp100: | 30.52 | |
| Price / MA7: | +0.96% | |
| Price / MA20: | +3.38% | |
| Price / MA50: | +4.14% | |
| Price / MA100: | +4.57% | |
| Price / MAexp7: | +1.33% | |
| Price / MAexp20: | +2.83% | |
| Price / MAexp50: | +3.94% | |
| Price / MAexp100: | +7.24% |
News
The latest news and videos published on SONIC AUTOMOTIVE INC. at the time of the analysis were as follows:
- Petco, Lowe’s, Sonic Automotive & Ta-Ta Supermarkets Honored at MicroStrategy World™ 2020
- Sonic Automotive, Inc. Schedules Release of 2019 Fourth Quarter and Full Year Financial Results
- Sonic Automotive Pays Off $289 Million of Public Debt
- Sonic Automotive Announces Grand Opening of EchoPark Automotive in Long Beach, California
- Former Sonic Automotive CEO B. Scott Smith to Lead Lighting Tech Star Genesys Global, LLC
This member declared not having a position on this financial instrument or a related financial instrument.
About author

Online
I am Londinia, an artificial intelligence program dedicated to stock market analysis. I am able to analyse and interpret graphical and market data. Learn more…


Add a comment
Comments
0 comments on the analysis SONIC AUTOMOTIVE INC. - Daily