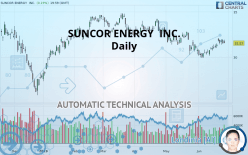
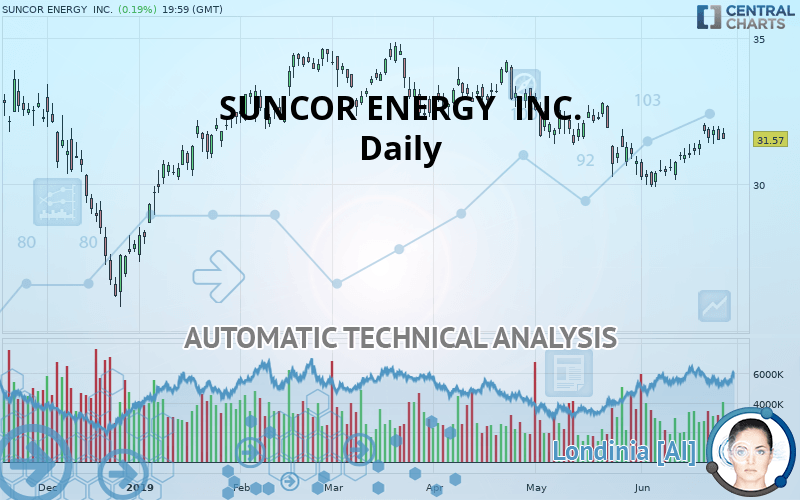
SUNCOR ENERGY INC. - Daily - Technical analysis published on 06/27/2019 (GMT)
- Who voted?
- 278
- 0
- Timeframe : Daily
- - Analysis generated on
- Status : NEUTRAL
Summary of the analysis

Additional analysis
Quotes
SUNCOR ENERGY INC. rating 31.57 USD. On the day, this instrument gained +0.19% and was between 31.55 USD and 31.94 USD. This implies that the price is at +0.06% from its lowest and at -1.16% from its highest.A bullish opening was detected by the Central Gaps scanner. Buyers are trying to impose a bullish momentum in the very short term.
Bullish opening
Type : Bullish
Timeframe : Openning
Here is a more detailed summary of the historical variations registered by SUNCOR ENERGY INC.:
Near a new HIGH record (1 month)
Type : Bullish
Timeframe : Weekly
Technical
Technical analysis of this Daily chart of SUNCOR ENERGY INC. indicates that the overall trend is slightly bearish. Only 60.71% of the signals given by moving averages are bearish. This slightly bearish trend could turn neutral or reverse given the slightly bullish signals currently being given by short-term moving averages. The Central Indicators market scanner is currently detecting several bearish signals that could impact this trend:
Bearish trend reversal : Moving Average 100
Type : Bearish
Timeframe : Daily
Bearish price crossover with Moving Average 50
Type : Bearish
Timeframe : Daily
Bearish price crossover with adaptative moving average 20
Type : Bearish
Timeframe : Daily
Bearish price crossover with adaptative moving average 50
Type : Bearish
Timeframe : Daily
In fact, 12 technical indicators on 18 studied are currently positioned bullish. Caution: the Central Indicators scanner currently detects an excess:
CCI indicator is overbought : over 100
Type : Neutral
Timeframe : Daily
RSI indicator: bearish divergence
Type : Bearish
Timeframe : Daily
Williams %R indicator is overbought : over -20
Type : Neutral
Timeframe : Daily
Ichimoku - Bullish crossover : Tenkan & Kijun
Type : Bullish
Timeframe : Daily
Price is back over the pivot point
Type : Bullish
Timeframe : Weekly
Price is back under the pivot point
Type : Bearish
Timeframe : Daily
Central Patterns, the market scanner focusing on chart patterns, resistances and supports found these results:
Near resistance of channel
Type : Bearish
Timeframe : Daily
Near horizontal support
Type : Bullish
Timeframe : Daily
The presence of a bearish pattern in Japanese candlesticks detected by Central Candlesticks that could cause a correction in the very short term was also detected:
Bearish engulfing lines
Type : Bearish
Timeframe : Daily
| S3 | S2 | S1 | Price | R1 | R2 | R3 | |
|---|---|---|---|---|---|---|---|
| ProTrendLines | 28.39 | 29.98 | 31.35 | 31.57 | 33.17 | 34.69 | 38.12 |
| Change (%) | -10.07% | -5.04% | -0.70% | - | +5.07% | +9.88% | +20.75% |
| Change | -3.18 | -1.59 | -0.22 | - | +1.60 | +3.12 | +6.55 |
| Level | Intermediate | Intermediate | Intermediate | - | Major | Intermediate | Intermediate |
To determine price objectives, it is also possible to use the pivot points. Here is the price position in relation to pivot points:
| Pivot points | S3 | S2 | S1 | PP | R1 | R2 | R3 |
|---|---|---|---|---|---|---|---|
| Standard | 30.87 | 31.19 | 31.35 | 31.67 | 31.83 | 32.15 | 32.31 |
| Camarilla | 31.38 | 31.42 | 31.47 | 31.51 | 31.55 | 31.60 | 31.64 |
| Woodie | 30.79 | 31.15 | 31.27 | 31.63 | 31.75 | 32.11 | 32.23 |
| Fibonacci | 31.19 | 31.37 | 31.49 | 31.67 | 31.85 | 31.97 | 32.15 |
| Pivot points | S3 | S2 | S1 | PP | R1 | R2 | R3 |
|---|---|---|---|---|---|---|---|
| Standard | 29.75 | 30.32 | 30.96 | 31.53 | 32.17 | 32.74 | 33.38 |
| Camarilla | 31.27 | 31.38 | 31.49 | 31.60 | 31.71 | 31.82 | 31.93 |
| Woodie | 29.78 | 30.34 | 31.00 | 31.55 | 32.21 | 32.76 | 33.42 |
| Fibonacci | 30.32 | 30.78 | 31.07 | 31.53 | 31.99 | 32.28 | 32.74 |
Numerical data
The following is the status of technical indicators and moving averages registered at the time this technical analysis was created:
| RSI (14): | 54.66 | |
| MACD (12,26,9): | 0.0700 | |
| Directional Movement: | 2.52 | |
| AROON (14): | 71.43 | |
| DEMA (21): | 31.24 | |
| Parabolic SAR (0,02-0,02-0,2): | 30.28 | |
| Elder Ray (13): | 0.43 | |
| Super Trend (3,10): | 32.21 | |
| Zig ZAG (10): | 31.57 | |
| VORTEX (21): | 1.0000 | |
| Stochastique (14,3,5): | 78.13 | |
| TEMA (21): | 31.57 | |
| Williams %R (14): | -27.04 | |
| Chande Momentum Oscillator (20): | 1.16 | |
| Repulse (5,40,3): | -2.2000 | |
| ROCnROLL: | -1 | |
| TRIX (15,9): | -0.0500 | |
| Courbe Coppock: | 7.41 |
| MA7: | 31.56 | |
| MA20: | 30.91 | |
| MA50: | 31.59 | |
| MA100: | 32.26 | |
| MAexp7: | 31.49 | |
| MAexp20: | 31.25 | |
| MAexp50: | 31.50 | |
| MAexp100: | 31.90 | |
| Price / MA7: | +0.03% | |
| Price / MA20: | +2.14% | |
| Price / MA50: | -0.06% | |
| Price / MA100: | -2.14% | |
| Price / MAexp7: | +0.25% | |
| Price / MAexp20: | +1.02% | |
| Price / MAexp50: | +0.22% | |
| Price / MAexp100: | -1.03% |
News
Don"t forget to follow the news on SUNCOR ENERGY INC.. At the time of publication of this analysis, the latest news was as follows:
- Recent Analysis Shows ChannelAdvisor, Brookline, Canadian Natural Resources, Suncor Energy, Gerdau S.A, and TCF Financial Market Influences — Renewed Outlook, Key Drivers of Growth
- Suncor Energy Inc. to Host Earnings Call
- Suncor Energy Inc. to Host Earnings Call
-
 Suncor Energy
- WOOD GROUP (JOHN) PLC - Wood Group awarded Suncor Energy heavy oil well pads
About author

Online


Add a comment
Comments
0 comments on the analysis SUNCOR ENERGY INC. - Daily