SUN COMMUNITIES INC. - Daily - Technical analysis published on 11/20/2019 (GMT)
- Who voted?
- 204
- 0
Click here for a new analysis!
- Timeframe : Daily
- - Analysis generated on
- Status : INVALID
Summary of the analysis

Additional analysis
Quotes
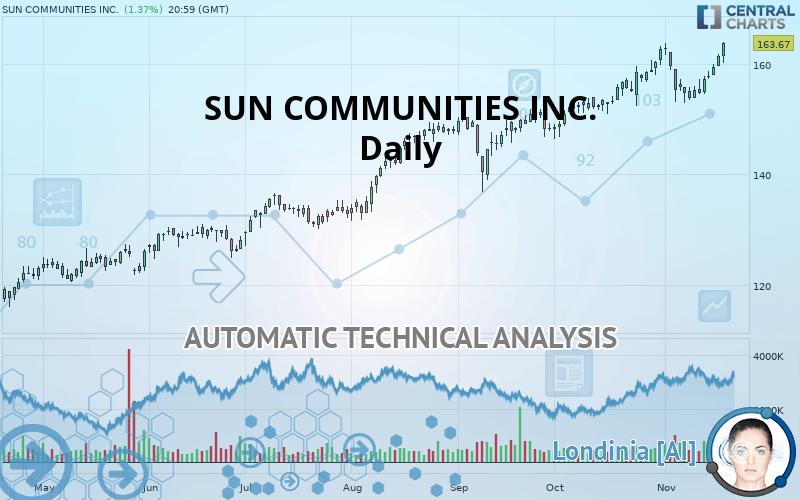
The SUN COMMUNITIES INC. rating is 163.67 USD. The price registered an increase of +1.37% on the session with the lowest point at 160.16 USD and the highest point at 163.91 USD. The deviation from the price is +2.19% for the low point and -0.15% for the high point.A bearish opening was detected by the Central Gaps scanner. Sellers are trying to impose a bearish trend in the very short term.
Bearish opening
Type : Bearish
Timeframe : Openning
So that you have an overall view of the price change, here is a table showing the variations over several periods:
New HIGH record (5 years)
Type : Bullish
Timeframe : Weekly
New HIGH record (1 year)
Type : Bullish
Timeframe : Weekly
New HIGH record (1st january)
Type : Bullish
Timeframe : Weekly
New HIGH record (1 month)
Type : Bullish
Timeframe : Weekly
Near a new LOW record (1 month)
Type : Bearish
Timeframe : Weekly
Technical
A technical analysis in Daily of this SUN COMMUNITIES INC. chart shows a strongly bullish trend. The signals given by the moving averages are 92.86% bullish. This strong bullish trend is confirmed by the strong signals currently being given by short-term moving averages. The Central Indicators scanner does not detect any result on moving averages that would impact this trend.
In fact, 14 technical indicators on 18 studied are currently bullish. But beware of excesses. The Central Indicators scanner currently detects this:
CCI indicator is overbought : over 100
Type : Neutral
Timeframe : Daily
Williams %R indicator is overbought : over -20
Type : Neutral
Timeframe : Daily
Pivot points : price is over resistance 1
Type : Neutral
Timeframe : Weekly
Pivot points : price is over resistance 2
Type : Neutral
Timeframe : Daily
Parabolic SAR indicator bullish reversal
Type : Bullish
Timeframe : Daily
The Central Patterns scanner, which studies chart patterns, resistances and supports, has identified this signal:
Horizontal resistance is broken
Type : Bullish
Timeframe : Daily
The Central Candlesticks scanner, specialised in Japanese candlesticks, did not identify any signals.
| S3 | S2 | S1 | Price | |
|---|---|---|---|---|
| ProTrendLines | 136.16 | 140.45 | 162.71 | 163.67 |
| Change (%) | -16.81% | -14.19% | -0.59% | - |
| Change | -27.51 | -23.22 | -0.96 | - |
| Level | Intermediate | Minor | Major | - |
Pivot points can also be used to set your price objectives. Here is the price situation in relation to pivot points:
| Pivot points | S3 | S2 | S1 | PP | R1 | R2 | R3 |
|---|---|---|---|---|---|---|---|
| Standard | 157.94 | 158.75 | 160.11 | 160.92 | 162.28 | 163.09 | 164.45 |
| Camarilla | 160.86 | 161.06 | 161.26 | 161.46 | 161.66 | 161.86 | 162.06 |
| Woodie | 158.21 | 158.89 | 160.38 | 161.06 | 162.55 | 163.23 | 164.72 |
| Fibonacci | 158.75 | 159.58 | 160.09 | 160.92 | 161.75 | 162.26 | 163.09 |
| Pivot points | S3 | S2 | S1 | PP | R1 | R2 | R3 |
|---|---|---|---|---|---|---|---|
| Standard | 149.43 | 151.61 | 155.52 | 157.70 | 161.61 | 163.79 | 167.70 |
| Camarilla | 157.76 | 158.31 | 158.87 | 159.43 | 159.99 | 160.55 | 161.11 |
| Woodie | 150.30 | 152.04 | 156.39 | 158.13 | 162.48 | 164.22 | 168.57 |
| Fibonacci | 151.61 | 153.94 | 155.37 | 157.70 | 160.03 | 161.46 | 163.79 |
| Pivot points | S3 | S2 | S1 | PP | R1 | R2 | R3 |
|---|---|---|---|---|---|---|---|
| Standard | 134.73 | 140.54 | 151.60 | 157.41 | 168.47 | 174.28 | 185.34 |
| Camarilla | 158.01 | 159.56 | 161.10 | 162.65 | 164.20 | 165.74 | 167.29 |
| Woodie | 137.35 | 141.85 | 154.22 | 158.72 | 171.09 | 175.59 | 187.96 |
| Fibonacci | 140.54 | 146.99 | 150.97 | 157.41 | 163.86 | 167.84 | 174.28 |
Numerical data
The following is the status of the technical indicators and moving averages at the time of publication of this technical analysis:
| RSI (14): | 67.91 | |
| MACD (12,26,9): | 1.7900 | |
| Directional Movement: | 14.72 | |
| AROON (14): | 57.14 | |
| DEMA (21): | 160.00 | |
| Parabolic SAR (0,02-0,02-0,2): | 152.99 | |
| Elder Ray (13): | 3.54 | |
| Super Trend (3,10): | 153.77 | |
| Zig ZAG (10): | 163.67 | |
| VORTEX (21): | 1.0600 | |
| Stochastique (14,3,5): | 79.31 | |
| TEMA (21): | 159.84 | |
| Williams %R (14): | -2.16 | |
| Chande Momentum Oscillator (20): | 0.96 | |
| Repulse (5,40,3): | 3.8000 | |
| ROCnROLL: | 1 | |
| TRIX (15,9): | 0.1400 | |
| Courbe Coppock: | 0.20 |
| MA7: | 158.49 | |
| MA20: | 158.15 | |
| MA50: | 153.47 | |
| MA100: | 146.00 | |
| MAexp7: | 159.65 | |
| MAexp20: | 157.62 | |
| MAexp50: | 153.53 | |
| MAexp100: | 146.55 | |
| Price / MA7: | +3.27% | |
| Price / MA20: | +3.49% | |
| Price / MA50: | +6.65% | |
| Price / MA100: | +12.10% | |
| Price / MAexp7: | +2.52% | |
| Price / MAexp20: | +3.84% | |
| Price / MAexp50: | +6.60% | |
| Price / MAexp100: | +11.68% |
News
Don"t forget to follow the news on SUN COMMUNITIES INC.. At the time of publication of this analysis, the latest news was as follows:
- Sun Communities, Inc. Closes Acquisition of Jensen Portfolio
- Sun Communities, Inc. Reports 2019 Third Quarter Results
- Sun Communities, Inc. Announces Dates for Third Quarter 2019 Earnings Release and Conference Call
- Sun Communities, Inc. Declares Third Quarter 2019 Dividends
- Sun Communities, Inc. to Acquire 31-Community Manufactured Housing Portfolio
About author

Online


Add a comment
Comments
0 comments on the analysis SUN COMMUNITIES INC. - Daily