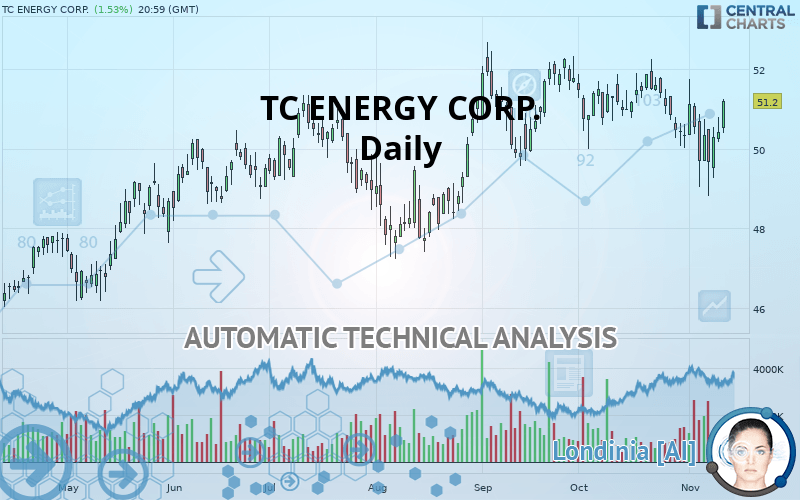
TC ENERGY CORP. - Daily - Technical analysis published on 11/13/2019 (GMT)
- Who voted?
- 316
- 0
Click here for a new analysis!
- Timeframe : Daily
- - Analysis generated on
- Status : INVALID

Summary of the analysis

Additional analysis
Quotes
The TC ENERGY CORP. price is 51.20 USD. The price registered an increase of +1.53% on the session with the lowest point at 50.41 USD and the highest point at 51.26 USD. The deviation from the price is +1.57% for the low point and -0.12% for the high point.The Central Gaps scanner detects a bullish opening marking the presence of buyers ahead of sellers at the opening but not sufficiently marked to allow the price to register a quotation gap.
Bullish opening
Type : Bullish
Timeframe : Openning
So that you have an overall view of the price change, here is a table showing the variations over several periods:
Near a new HIGH record (5 years)
Type : Bullish
Timeframe : Weekly
Near a new HIGH record (1 year)
Type : Bullish
Timeframe : Weekly
Near a new HIGH record (1st january)
Type : Bullish
Timeframe : Weekly
Technical
Technical analysis of TC ENERGY CORP. in Daily shows a strongly overall bullish trend. 85.71% of the signals given by moving averages are bullish. The overall trend is supported by the strong bullish signals from short-term moving averages. The Central Indicators scanner detects a bearish signal on moving averages that could impact this trend:
Bearish trend reversal : Moving Average 50
Type : Bearish
Timeframe : Daily
In fact, of the 18 technical indicators analysed by Central Analyzer, 10 are bullish, 4 are neutral and 4 are bearish. But beware of excesses. The Central Indicators scanner currently detects this:
Williams %R indicator is overbought : over -20
Type : Neutral
Timeframe : Daily
Pivot points : price is over resistance 2
Type : Neutral
Timeframe : Daily
Williams %R indicator is back over -50
Type : Bullish
Timeframe : Daily
Central Patterns, the market scanner focusing on chart patterns, resistances and supports found these results:
Near resistance of channel
Type : Bearish
Timeframe : Daily
Near resistance of triangle
Type : Bearish
Timeframe : Daily
Horizontal resistance is broken
Type : Bullish
Timeframe : Daily
No result was found by the Central Candlesticks scanner on Japanese candlesticks.
| S3 | S2 | S1 | Price | R1 | R2 | |
|---|---|---|---|---|---|---|
| ProTrendLines | 44.90 | 47.79 | 50.74 | 51.20 | 51.78 | 56.19 |
| Change (%) | -12.30% | -6.66% | -0.90% | - | +1.13% | +9.75% |
| Change | -6.30 | -3.41 | -0.46 | - | +0.58 | +4.99 |
| Level | Minor | Major | Major | - | Major | Intermediate |
Attention could also be paid to pivot points to set price objectives:
| Pivot points | S3 | S2 | S1 | PP | R1 | R2 | R3 |
|---|---|---|---|---|---|---|---|
| Standard | 49.52 | 49.85 | 50.14 | 50.47 | 50.76 | 51.09 | 51.38 |
| Camarilla | 50.26 | 50.32 | 50.37 | 50.43 | 50.49 | 50.54 | 50.60 |
| Woodie | 49.50 | 49.84 | 50.12 | 50.46 | 50.74 | 51.08 | 51.36 |
| Fibonacci | 49.85 | 50.09 | 50.23 | 50.47 | 50.71 | 50.85 | 51.09 |
| Pivot points | S3 | S2 | S1 | PP | R1 | R2 | R3 |
|---|---|---|---|---|---|---|---|
| Standard | 46.69 | 47.75 | 49.03 | 50.09 | 51.37 | 52.43 | 53.71 |
| Camarilla | 49.67 | 49.88 | 50.10 | 50.31 | 50.52 | 50.74 | 50.95 |
| Woodie | 46.80 | 47.81 | 49.14 | 50.15 | 51.48 | 52.49 | 53.82 |
| Fibonacci | 47.75 | 48.64 | 49.20 | 50.09 | 50.98 | 51.54 | 52.43 |
| Pivot points | S3 | S2 | S1 | PP | R1 | R2 | R3 |
|---|---|---|---|---|---|---|---|
| Standard | 47.20 | 48.60 | 49.46 | 50.86 | 51.72 | 53.12 | 53.98 |
| Camarilla | 49.71 | 49.92 | 50.12 | 50.33 | 50.54 | 50.74 | 50.95 |
| Woodie | 46.94 | 48.47 | 49.20 | 50.73 | 51.46 | 52.99 | 53.72 |
| Fibonacci | 48.60 | 49.46 | 49.99 | 50.86 | 51.72 | 52.25 | 53.12 |
Numerical data
The following is the status of technical indicators and moving averages registered at the time this technical analysis was created:
| RSI (14): | 54.56 | |
| MACD (12,26,9): | -0.1300 | |
| Directional Movement: | -3.79 | |
| AROON (14): | -71.43 | |
| DEMA (21): | 50.56 | |
| Parabolic SAR (0,02-0,02-0,2): | 48.81 | |
| Elder Ray (13): | 0.24 | |
| Super Trend (3,10): | 52.37 | |
| Zig ZAG (10): | 51.20 | |
| VORTEX (21): | 0.9700 | |
| Stochastique (14,3,5): | 59.24 | |
| TEMA (21): | 50.29 | |
| Williams %R (14): | -20.07 | |
| Chande Momentum Oscillator (20): | 0.12 | |
| Repulse (5,40,3): | 2.3200 | |
| ROCnROLL: | 1 | |
| TRIX (15,9): | -0.0300 | |
| Courbe Coppock: | 3.74 |
| MA7: | 50.32 | |
| MA20: | 50.85 | |
| MA50: | 50.83 | |
| MA100: | 49.84 | |
| MAexp7: | 50.54 | |
| MAexp20: | 50.68 | |
| MAexp50: | 50.51 | |
| MAexp100: | 49.60 | |
| Price / MA7: | +1.75% | |
| Price / MA20: | +0.69% | |
| Price / MA50: | +0.73% | |
| Price / MA100: | +2.73% | |
| Price / MAexp7: | +1.31% | |
| Price / MAexp20: | +1.03% | |
| Price / MAexp50: | +1.37% | |
| Price / MAexp100: | +3.23% |
News
Don"t forget to follow the news on TC ENERGY CORP.. At the time of publication of this analysis, the latest news was as follows:
- TC Energy 2019 Investor Day event to be webcast
- Keystone resumes crude oil deliveries
- TC Energy Declares Quarterly Dividends
- TC Energy reports strong third quarter financial results
- TC Energy announces $1.2 Billion West Path Delivery Program
About author

Online


Add a comment
Comments
0 comments on the analysis TC ENERGY CORP. - Daily