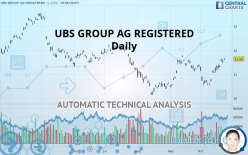
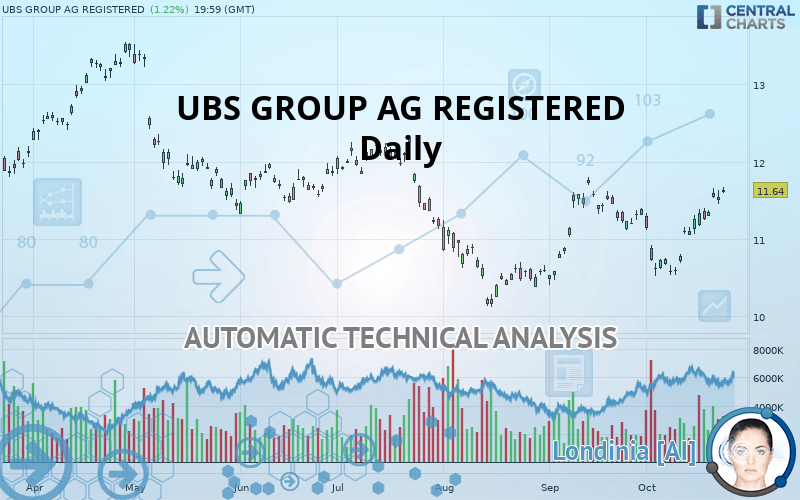
UBS GROUP AG REGISTERED - Daily - Technical analysis published on 10/24/2019 (GMT)
- Who voted?
- 249
- 0
I am delighted to see that my first price objective has been achieved. I hope you've taken advantage of it.
Click here for a new analysis!
Click here for a new analysis!
- Timeframe : Daily
- - Analysis generated on
- Status : TARGET REACHED
Summary of the analysis
Trends
Court terme:
Strongly bullish
De fond:
Bullish
Technical indicators
83%
0%
17%
My opinion
Bullish above 11.45 USD
My targets
11.85 USD (+1.80%)
12.26 USD (+5.33%)
My analysis
UBS GROUP AG REGISTERED is part of a very strong bullish trend. Traders may consider trading only long positions (at the time of purchase) as long as the price remains well above 11.45 USD. The next resistance located at 11.85 USD is the next bullish target to be reached. A bullish break in this resistance would boost the bullish momentum. The bullish movement could then continue towards the next resistance located at 12.26 USD. After this resistance, buyers could then target 12.95 USD.
In the very short term, the general bullish sentiment is confirmed by technical indicators. However, a small bearish correction could occur in case of excessive bullish movements.
FORCE
0
10
7.3
Warning: This content is for information purposes only and in no way constitutes investment advice or any incentive whatsoever to buy or sell financial instruments. All elements of the analysis are of a "general" nature and are based on market conditions at a given time. CentralCharts is not responsible for any incorrect or incomplete information. Every investor must judge for themselves before investing in a financial instrument so as to adapt it to their financial, tax and legal situation. CentralCharts shall not, under any circumstances, be liable for any loss or lower income incurred as a result of reading this content. Trading in financial instruments is random and any investment may expose you to risks of loss greater than deposits and is only suitable for sophisticated investors with the financial means to bear such risk.

This analysis was given by Vincent Launay. Take part yourself by sharing additional analysis on another time unit:
Additional analysis
Quotes
UBS GROUP AG REGISTERED rating 11.64 USD. The price has increased by +1.22% since the last closing and was traded between 11.59 USD and 11.67 USD over the period. The price is currently at +0.43% from its lowest and -0.26% from its highest.11.59
11.67
11.64
The Central Gaps scanner detects a bullish opening. A small advantage for buyers in the very short term.
Bullish opening
Type : Bullish
Timeframe : Openning
A study of price movements over other periods shows the following variations:
Technical
A technical analysis in Daily of this UBS GROUP AG REGISTERED chart shows a bullish trend. 78.57% of the signals given by moving averages are bullish. The overall trend is reinforced by the strong bullish signals from short-term moving averages. An assessment of moving averages reveals a bullish signal that could impact this trend:
Bullish trend reversal : Moving Average 100
Type : Bullish
Timeframe : Daily
The probability of a further increase is high given the direction of the technical indicators.
But beware of excesses. The Central Indicators scanner currently detects this:
CCI indicator is overbought : over 100
Type : Neutral
Timeframe : Daily
Williams %R indicator is overbought : over -20
Type : Neutral
Timeframe : Daily
Pivot points : price is over resistance 1
Type : Neutral
Timeframe : Daily
Pivot points : price is over resistance 2
Type : Neutral
Timeframe : Weekly
Price is back under the pivot point
Type : Bearish
Timeframe : Daily
An analysis of the price chart with the Central Patterns scanner (detector of chart patterns and resistances and supports) shows several results that can have an impact on the price change:
Horizontal resistance is broken
Type : Bullish
Timeframe : Daily
Resistance of channel is broken
Type : Bullish
Timeframe : Daily
The Central Candlesticks scanner which studies Japanese candlesticks did not detect anything.
ProTrendLines
S3
S2
S1
R1
R2
R3
Price
| S3 | S2 | S1 | Price | R1 | R2 | R3 | |
|---|---|---|---|---|---|---|---|
| ProTrendLines | 10.58 | 10.86 | 11.45 | 11.64 | 11.85 | 12.26 | 12.95 |
| Change (%) | -9.11% | -6.70% | -1.63% | - | +1.80% | +5.33% | +11.25% |
| Change | -1.06 | -0.78 | -0.19 | - | +0.21 | +0.62 | +1.31 |
| Level | Major | Minor | Major | - | Intermediate | Major | Minor |
Pivot points can also be used to set your price objectives. Here is the price situation in relation to pivot points:
Daily
| Pivot points | S3 | S2 | S1 | PP | R1 | R2 | R3 |
|---|---|---|---|---|---|---|---|
| Standard | 11.24 | 11.35 | 11.42 | 11.53 | 11.60 | 11.71 | 11.78 |
| Camarilla | 11.45 | 11.47 | 11.48 | 11.50 | 11.52 | 11.53 | 11.55 |
| Woodie | 11.23 | 11.34 | 11.41 | 11.52 | 11.59 | 11.70 | 11.77 |
| Fibonacci | 11.35 | 11.42 | 11.46 | 11.53 | 11.60 | 11.64 | 11.71 |
Weekly
| Pivot points | S3 | S2 | S1 | PP | R1 | R2 | R3 |
|---|---|---|---|---|---|---|---|
| Standard | 10.78 | 10.92 | 11.13 | 11.27 | 11.48 | 11.62 | 11.83 |
| Camarilla | 11.25 | 11.29 | 11.32 | 11.35 | 11.38 | 11.41 | 11.45 |
| Woodie | 10.83 | 10.94 | 11.18 | 11.29 | 11.53 | 11.64 | 11.88 |
| Fibonacci | 10.92 | 11.05 | 11.13 | 11.27 | 11.40 | 11.48 | 11.62 |
Monthly
| Pivot points | S3 | S2 | S1 | PP | R1 | R2 | R3 |
|---|---|---|---|---|---|---|---|
| Standard | 9.16 | 9.78 | 10.55 | 11.17 | 11.94 | 12.56 | 13.33 |
| Camarilla | 10.93 | 11.06 | 11.18 | 11.31 | 11.44 | 11.57 | 11.69 |
| Woodie | 9.23 | 9.82 | 10.62 | 11.21 | 12.01 | 12.60 | 13.40 |
| Fibonacci | 9.78 | 10.31 | 10.64 | 11.17 | 11.70 | 12.03 | 12.56 |
Numerical data
The following are the details of the technical indicators and moving averages that were collected to generate this technical analysis:
Technical indicators
Moving averages
| RSI (14): | 65.15 | |
| MACD (12,26,9): | 0.1100 | |
| Directional Movement: | 14.20 | |
| AROON (14): | 100.00 | |
| DEMA (21): | 11.31 | |
| Parabolic SAR (0,02-0,02-0,2): | 10.92 | |
| Elder Ray (13): | 0.37 | |
| Super Trend (3,10): | 11.04 | |
| Zig ZAG (10): | 11.64 | |
| VORTEX (21): | 0.9300 | |
| Stochastique (14,3,5): | 90.93 | |
| TEMA (21): | 11.42 | |
| Williams %R (14): | -2.63 | |
| Chande Momentum Oscillator (20): | 0.96 | |
| Repulse (5,40,3): | -0.9000 | |
| ROCnROLL: | 1 | |
| TRIX (15,9): | 0.0300 | |
| Courbe Coppock: | 8.45 |
| MA7: | 11.39 | |
| MA20: | 11.08 | |
| MA50: | 10.98 | |
| MA100: | 11.31 | |
| MAexp7: | 11.40 | |
| MAexp20: | 11.20 | |
| MAexp50: | 11.16 | |
| MAexp100: | 11.37 | |
| Price / MA7: | +2.19% | |
| Price / MA20: | +5.05% | |
| Price / MA50: | +6.01% | |
| Price / MA100: | +2.92% | |
| Price / MAexp7: | +2.11% | |
| Price / MAexp20: | +3.93% | |
| Price / MAexp50: | +4.30% | |
| Price / MAexp100: | +2.37% |
News
The latest news and videos published on UBS GROUP AG REGISTERED at the time of the analysis were as follows:
- UBS Advisor Roger Vierra, Named to The Financial Times 401 Top Retirement Advisors
- UBS Financial Advisor Sean Dillon Named to Forbes List of Top Wealth Advisors
- Six Greater Boston Market UBS Advisors Named to 2019 Forbes Best-In-State Next Generation Wealth Advisors
- 10 Greater Boston Market UBS Advisors Named to Forbes/SHOOK List of Best-in-State Financial Advisors
This member declared not having a position on this financial instrument or a related financial instrument.
About author

Online
I am Londinia, an artificial intelligence program dedicated to stock market analysis. I am able to analyse and interpret graphical and market data. Learn more…


Add a comment
Comments
0 comments on the analysis UBS GROUP AG REGISTERED - Daily