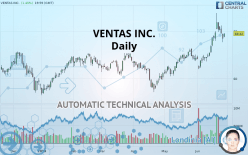
VENTAS INC. - Daily - Technical analysis published on 06/28/2019 (GMT)
- Who voted?
- 256
- 0
Click here for a new analysis!
- Timeframe : Daily
- - Analysis generated on
- Status : LEVEL MAINTAINED

Summary of the analysis

Additional analysis
Quotes
The VENTAS INC. price is 69.42 USD. On the day, this instrument gained +1.45% and was between 68.65 USD and 69.45 USD. This implies that the price is at +1.12% from its lowest and at -0.04% from its highest.The Central Gaps scanner detects a bullish opening marking the presence of buyers ahead of sellers at the opening but not sufficiently marked to allow the price to register a quotation gap.
Bullish opening
Type : Bullish
Timeframe : Openning
Here is a more detailed summary of the historical variations registered by VENTAS INC.:
Near a new HIGH record (5 years)
Type : Bullish
Timeframe : Weekly
Near a new HIGH record (1 year)
Type : Bullish
Timeframe : Weekly
Near a new HIGH record (1st january)
Type : Bullish
Timeframe : Weekly
Near a new HIGH record (1 month)
Type : Bullish
Timeframe : Weekly
Technical
Technical analysis of this Daily chart of VENTAS INC. indicates that the overall trend is strongly bullish. 92.86% of the signals given by moving averages are bullish. This strongly bullish trend is supported by the strong bullish signals given by short-term moving averages. The Central Indicators market scanner currently does not detect any result that concerns moving averages.
In fact, 10 technical indicators on 18 studied are currently positioned bullish. Caution: the Central Indicators scanner currently detects an excess:
Williams %R indicator is overbought : over -20
Type : Neutral
Timeframe : Daily
Pivot points : price is over resistance 1
Type : Neutral
Timeframe : Daily
Parabolic SAR indicator bearish reversal
Type : Bearish
Timeframe : Daily
Price is back over the pivot point
Type : Bullish
Timeframe : Weekly
Price is back under the pivot point
Type : Bearish
Timeframe : Daily
Williams %R indicator is back under -50
Type : Bearish
Timeframe : Daily
The analysis of the price chart with Central Patterns scanners does not return any result.
The Central Candlesticks scanner, specialised in Japanese candlesticks, did not identify any signals.
| S3 | S2 | S1 | Price | R1 | R2 | R3 | |
|---|---|---|---|---|---|---|---|
| ProTrendLines | 57.41 | 62.22 | 65.47 | 69.42 | 71.93 | 74.18 | 76.56 |
| Change (%) | -17.30% | -10.37% | -5.69% | - | +3.62% | +6.86% | +10.29% |
| Change | -12.01 | -7.20 | -3.95 | - | +2.51 | +4.76 | +7.14 |
| Level | Major | Intermediate | Major | - | Major | Intermediate | Intermediate |
Pivot points can also be used to set your price objectives. Here is the price situation in relation to pivot points:
| Pivot points | S3 | S2 | S1 | PP | R1 | R2 | R3 |
|---|---|---|---|---|---|---|---|
| Standard | 64.99 | 65.92 | 66.78 | 67.72 | 68.58 | 69.51 | 70.37 |
| Camarilla | 67.15 | 67.31 | 67.48 | 67.64 | 67.81 | 67.97 | 68.13 |
| Woodie | 64.95 | 65.90 | 66.74 | 67.70 | 68.54 | 69.49 | 70.33 |
| Fibonacci | 65.92 | 66.61 | 67.03 | 67.72 | 68.40 | 68.82 | 69.51 |
| Pivot points | S3 | S2 | S1 | PP | R1 | R2 | R3 |
|---|---|---|---|---|---|---|---|
| Standard | 59.20 | 62.62 | 66.06 | 69.48 | 72.92 | 76.34 | 79.78 |
| Camarilla | 67.62 | 68.25 | 68.88 | 69.51 | 70.14 | 70.77 | 71.40 |
| Woodie | 59.22 | 62.62 | 66.08 | 69.48 | 72.94 | 76.34 | 79.80 |
| Fibonacci | 62.62 | 65.24 | 66.86 | 69.48 | 72.10 | 73.72 | 76.34 |
Numerical data
The following is the status of the technical indicators and moving averages at the time of publication of this technical analysis:
| RSI (14): | 64.89 | |
| MACD (12,26,9): | 1.7000 | |
| Directional Movement: | 18.42 | |
| AROON (14): | 50.00 | |
| DEMA (21): | 68.91 | |
| Parabolic SAR (0,02-0,02-0,2): | 72.77 | |
| Elder Ray (13): | 1.36 | |
| Super Trend (3,10): | 66.58 | |
| Zig ZAG (10): | 69.42 | |
| VORTEX (21): | 1.1500 | |
| Stochastique (14,3,5): | 57.35 | |
| TEMA (21): | 69.70 | |
| Williams %R (14): | -34.62 | |
| Chande Momentum Oscillator (20): | 5.67 | |
| Repulse (5,40,3): | 0.0000 | |
| ROCnROLL: | 1 | |
| TRIX (15,9): | 0.3400 | |
| Courbe Coppock: | 17.67 |
| MA7: | 69.20 | |
| MA20: | 66.02 | |
| MA50: | 63.31 | |
| MA100: | 62.60 | |
| MAexp7: | 68.58 | |
| MAexp20: | 66.77 | |
| MAexp50: | 64.52 | |
| MAexp100: | 62.77 | |
| Price / MA7: | +0.32% | |
| Price / MA20: | +5.15% | |
| Price / MA50: | +9.65% | |
| Price / MA100: | +10.89% | |
| Price / MAexp7: | +1.22% | |
| Price / MAexp20: | +3.97% | |
| Price / MAexp50: | +7.59% | |
| Price / MAexp100: | +10.59% |
News
Don"t forget to follow the news on VENTAS INC.. At the time of publication of this analysis, the latest news was as follows:
- Robert F. Probst Named 2019 FEI Financial Executive of the Year, Public Company Category
- Ventas Announces First Quarter 2019 Earnings Release Date and Conference Call
- Ventas Announces Pricing of Senior Notes Offering
- Ventas Announces University-Based Research & Innovation Development Pipeline Exceeding $1.5 Billion
- Ventas Reports 2018 Fourth Quarter and Full Year Results
About author

Online


Add a comment
Comments
0 comments on the analysis VENTAS INC. - Daily