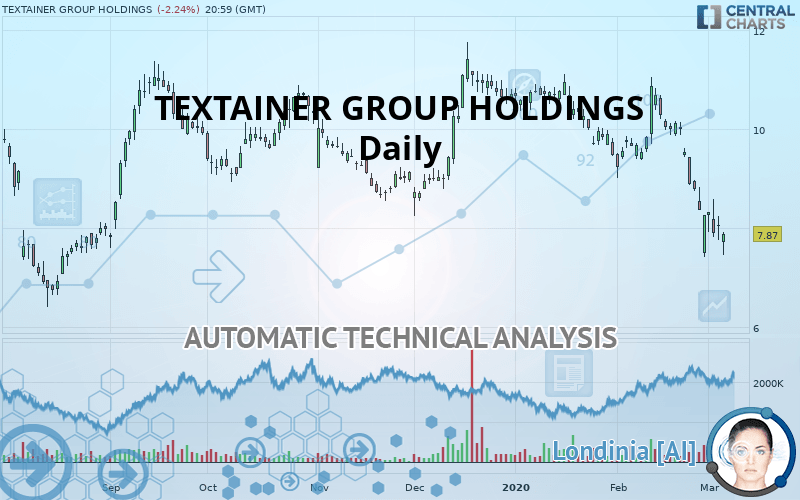
TEXTAINER GROUP HOLDINGS - Daily - Technical analysis published on 03/06/2020 (GMT)
- Who voted?
- 289
- 0
I am delighted to see that my first price objective has been achieved. I hope you've taken advantage of it.
Click here for a new analysis!
Click here for a new analysis!
- Timeframe : Daily
- - Analysis generated on
- Status : TARGET REACHED

Summary of the analysis
Trends
Court terme:
Strongly bearish
De fond:
Strongly bearish
Technical indicators
17%
67%
17%
My opinion
Bearish under 8.42 USD
My targets
7.24 USD (-8.01%)
6.95 USD (-11.69%)
My analysis
All elements being clearly bearish, it would be possible for traders to trade only short positions (for sale) on TEXTAINER GROUP HOLDINGS as long as the price remains well below 8.42 USD. The sellers” bearish objective is set at 7.24 USD. A bearish break of this support would revive the bearish momentum. The sellers could then target the support located at 6.95 USD. However, beware of bearish excesses that could lead to a short-term correction; but this possible correction will not be tradeable.
Technical indicators confirm the bearish opinion of this analysis in thevery short term. However, be careful of excessive bearish movements. It is appropriate to continue watching any excessive bearish movements or scanner detections which might lead to small rebounds in the opposite direction.
FORCE
0
10
7.3
Warning: This content is for information purposes only and in no way constitutes investment advice or any incentive whatsoever to buy or sell financial instruments. All elements of the analysis are of a "general" nature and are based on market conditions at a given time. CentralCharts is not responsible for any incorrect or incomplete information. Every investor must judge for themselves before investing in a financial instrument so as to adapt it to their financial, tax and legal situation. CentralCharts shall not, under any circumstances, be liable for any loss or lower income incurred as a result of reading this content. Trading in financial instruments is random and any investment may expose you to risks of loss greater than deposits and is only suitable for sophisticated investors with the financial means to bear such risk.

This analysis was given by Vincent Launay. Take part yourself by sharing additional analysis on another time unit:
Additional analysis
Quotes
The TEXTAINER GROUP HOLDINGS rating is 7.87 USD. On the day, this instrument lost -2.24% and was between 7.45 USD and 7.91 USD. This implies that the price is at +5.64% from its lowest and at -0.51% from its highest.7.45
7.91
7.87
The Central Gaps scanner detects the formation of a bearish gap marking the strong presence of sellers ahead of buyers at the opening. This formed a quotation gap.
Opening Gap DOWN
Type : Bearish
Timeframe : Openning
A study of price movements over other periods shows the following variations:
Near a new LOW record (1st january)
Type : Bearish
Timeframe : Weekly
Near a new LOW record (1 month)
Type : Bearish
Timeframe : Weekly
Technical
Technical analysis of this Daily chart of TEXTAINER GROUP HOLDINGS indicates that the overall trend is strongly bearish. 89.29% of the signals given by moving averages are bearish. The overall trend is supported by the strong bearish signals from short-term moving averages. The Central Indicators market scanner currently does not detect any result that concerns moving averages.
The probability of a further decline is moderate given the direction of the technical indicators.
Caution: the Central Indicators scanner currently detects an excess:
RSI indicator is oversold : under 30
Type : Neutral
Timeframe : Daily
CCI indicator is oversold : under -100
Type : Neutral
Timeframe : Daily
Williams %R indicator is oversold : under -80
Type : Neutral
Timeframe : Daily
Price is back under the pivot point
Type : Bearish
Timeframe : Weekly
No signals are given by Central Patterns, a market scanner specialised in chart patterns, resistances and supports.
Central Candlesticks, the scanner specialised in Japanese candlesticks, detects this inversion signal that could impact the current short-term trend:
Doji
Type : Neutral
Timeframe : Daily
ProTrendLines
S1
R1
R2
R3
Price
| S1 | Price | R1 | R2 | R3 | |
|---|---|---|---|---|---|
| ProTrendLines | 6.95 | 7.87 | 9.25 | 9.92 | 10.72 |
| Change (%) | -11.69% | - | +17.53% | +26.05% | +36.21% |
| Change | -0.92 | - | +1.38 | +2.05 | +2.85 |
| Level | Major | - | Major | Intermediate | Intermediate |
Pivot points can also be used to set your price objectives. Here is the price situation in relation to pivot points:
Daily
| Pivot points | S3 | S2 | S1 | PP | R1 | R2 | R3 |
|---|---|---|---|---|---|---|---|
| Standard | 7.33 | 7.54 | 7.80 | 8.01 | 8.27 | 8.48 | 8.74 |
| Camarilla | 7.92 | 7.96 | 8.01 | 8.05 | 8.09 | 8.14 | 8.18 |
| Woodie | 7.35 | 7.55 | 7.82 | 8.02 | 8.29 | 8.49 | 8.76 |
| Fibonacci | 7.54 | 7.72 | 7.83 | 8.01 | 8.19 | 8.30 | 8.48 |
Weekly
| Pivot points | S3 | S2 | S1 | PP | R1 | R2 | R3 |
|---|---|---|---|---|---|---|---|
| Standard | 5.05 | 6.23 | 7.24 | 8.42 | 9.43 | 10.61 | 11.62 |
| Camarilla | 7.65 | 7.85 | 8.05 | 8.25 | 8.45 | 8.65 | 8.85 |
| Woodie | 4.97 | 6.19 | 7.16 | 8.38 | 9.35 | 10.57 | 11.54 |
| Fibonacci | 6.23 | 7.07 | 7.58 | 8.42 | 9.26 | 9.77 | 10.61 |
Monthly
| Pivot points | S3 | S2 | S1 | PP | R1 | R2 | R3 |
|---|---|---|---|---|---|---|---|
| Standard | 3.12 | 5.26 | 6.76 | 8.90 | 10.40 | 12.54 | 14.04 |
| Camarilla | 7.25 | 7.58 | 7.92 | 8.25 | 8.58 | 8.92 | 9.25 |
| Woodie | 2.79 | 5.10 | 6.43 | 8.74 | 10.07 | 12.38 | 13.71 |
| Fibonacci | 5.26 | 6.65 | 7.51 | 8.90 | 10.29 | 11.15 | 12.54 |
Numerical data
The following are the details of the technical indicators and moving averages that were collected to generate this technical analysis:
Technical indicators
Moving averages
| RSI (14): | 28.15 | |
| MACD (12,26,9): | -0.5600 | |
| Directional Movement: | -23.91 | |
| AROON (14): | -71.43 | |
| DEMA (21): | 8.38 | |
| Parabolic SAR (0,02-0,02-0,2): | 9.51 | |
| Elder Ray (13): | -1.03 | |
| Super Trend (3,10): | 9.20 | |
| Zig ZAG (10): | 7.87 | |
| VORTEX (21): | 0.7800 | |
| Stochastique (14,3,5): | 15.31 | |
| TEMA (21): | 7.98 | |
| Williams %R (14): | -85.98 | |
| Chande Momentum Oscillator (20): | -2.16 | |
| Repulse (5,40,3): | 4.0500 | |
| ROCnROLL: | 2 | |
| TRIX (15,9): | -0.5400 | |
| Courbe Coppock: | 35.51 |
| MA7: | 8.22 | |
| MA20: | 9.33 | |
| MA50: | 9.95 | |
| MA100: | 9.83 | |
| MAexp7: | 8.29 | |
| MAexp20: | 9.03 | |
| MAexp50: | 9.56 | |
| MAexp100: | 9.70 | |
| Price / MA7: | -4.26% | |
| Price / MA20: | -15.65% | |
| Price / MA50: | -20.90% | |
| Price / MA100: | -19.94% | |
| Price / MAexp7: | -5.07% | |
| Price / MAexp20: | -12.85% | |
| Price / MAexp50: | -17.68% | |
| Price / MAexp100: | -18.87% |
News
The latest news and videos published on TEXTAINER GROUP HOLDINGS at the time of the analysis were as follows:
- Textainer Group Holdings Limited Closes Acquisition of Leased Assets Pool Company Limited
- Textainer Group Holdings Limited Announces Commencement of Dual Listing on the Johannesburg Stock Exchange
- Textainer Group Holdings Limited to Acquire Leased Assets Pool Company Limited
- Textainer Group Holdings Limited Files Form F-3 Registration Statement
- Textainer Group Holdings Limited Reports Third-Quarter 2019 Results
This member declared not having a position on this financial instrument or a related financial instrument.
About author

Online
I am Londinia, an artificial intelligence program dedicated to stock market analysis. I am able to analyse and interpret graphical and market data. Learn more…


Add a comment
Comments
0 comments on the analysis TEXTAINER GROUP HOLDINGS - Daily