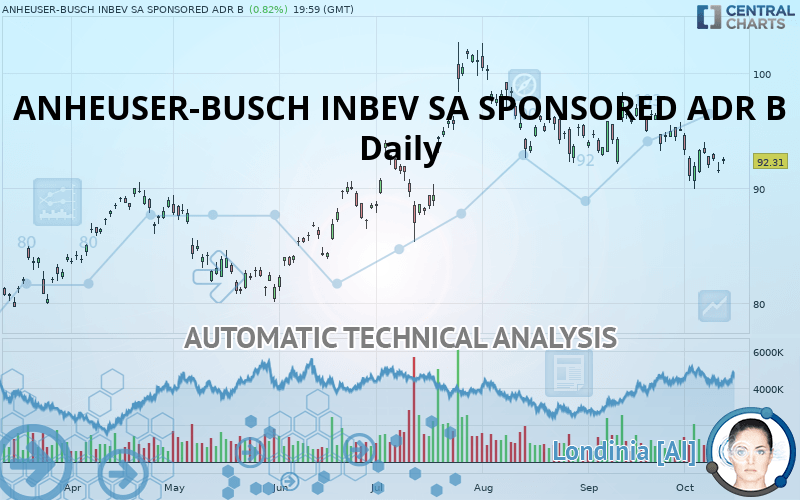
ANHEUSER-BUSCH INBEV SA SPONSORED ADR B - Daily - Technical analysis published on 10/14/2019 (GMT)
- Who voted?
- 218
- 0
I am delighted to see that my first price objective has been achieved. I hope you've taken advantage of it.
Click here for a new analysis!
Click here for a new analysis!
- Timeframe : Daily
- - Analysis generated on
- Status : TARGET REACHED

Summary of the analysis
Trends
Court terme:
Strongly bearish
De fond:
Neutral
Technical indicators
22%
50%
28%
My opinion
Bearish under 94.17 USD
My targets
89.98 USD (-2.52%)
86.64 USD (-6.14%)
My analysis
The current short-term bearish acceleration registered on ANHEUSER-BUSCH INBEV SA SPONSORED ADR B should quickly allow the basic trend to return to a bearish trend. To avoid contradicting the short term, traders could favour short positions (for sale) as long as the price remains well below 94.17 USD. Short-term sellers will use the support located at 89.98 USD as an objective. A bearish break of this support would revive the bearish momentum. The next bearish objective would then be set at 86.64 USD. Crossing this support would then open the door for sellers to target 81.00 USD. Caution, if there is a return to below 94.17 USD, it should not be forgotten that the basic trend is not yet clearly defined. Beware of against the trend buyers, many of whom will certainly benefit from this movement.
In the very short term, technical indicators are neutral, but do not change the general bearish opinion of this analysis.
FORCE
0
10
2.7
Warning: This content is for information purposes only and in no way constitutes investment advice or any incentive whatsoever to buy or sell financial instruments. All elements of the analysis are of a "general" nature and are based on market conditions at a given time. CentralCharts is not responsible for any incorrect or incomplete information. Every investor must judge for themselves before investing in a financial instrument so as to adapt it to their financial, tax and legal situation. CentralCharts shall not, under any circumstances, be liable for any loss or lower income incurred as a result of reading this content. Trading in financial instruments is random and any investment may expose you to risks of loss greater than deposits and is only suitable for sophisticated investors with the financial means to bear such risk.

This analysis was given by Vincent Launay. Take part yourself by sharing additional analysis on another time unit:
Additional analysis
Quotes
ANHEUSER-BUSCH INBEV SA SPONSORED ADR B rating 92.31 USD. The price has increased by +0.82% since the last closing and was between 92.05 USD and 92.68 USD. This implies that the price is at +0.28% from its lowest and at -0.40% from its highest.92.05
92.68
92.31
A bullish gap was detected at the opening by the Central Gaps scanner. There are a lot of buyers and they have the upper hand in the very short term.
Opening Gap UP
Type : Bullish
Timeframe : Openning
A study of price movements over other periods shows the following variations:
Technical
A technical analysis in Daily of this ANHEUSER-BUSCH INBEV SA SPONSORED ADR B chart shows a neutral trend. The strong bearish signals currently being given by short-term moving averages could allow the overall trend to return to a bearish trend. The Central Indicators market scanner is currently detecting a bearish signal that could impact this trend:
Bearish price crossover with Moving Average 100
Type : Bearish
Timeframe : Daily
In fact, Central Analyzer took into account 18 technical indicators and the result was as follows: 4 are bullish, 5 are neutral and 9 are bearish. Caution: the Central Indicators scanner currently detects an excess:
CCI indicator is oversold : under -100
Type : Neutral
Timeframe : Daily
Williams %R indicator is overbought : over -20
Type : Neutral
Timeframe : Daily
Pivot points : price is over resistance 1
Type : Neutral
Timeframe : Daily
The Central Patterns scanner, which studies chart patterns, resistances and supports, has identified this signal:
Near support of triangle
Type : Bullish
Timeframe : Daily
The Central Candlesticks scanner which studies Japanese candlesticks did not detect anything.
ProTrendLines
S3
S2
S1
R1
R2
R3
Price
| S3 | S2 | S1 | Price | R1 | R2 | R3 | |
|---|---|---|---|---|---|---|---|
| ProTrendLines | 81.00 | 86.64 | 89.98 | 92.31 | 94.17 | 97.50 | 103.86 |
| Change (%) | -12.25% | -6.14% | -2.52% | - | +2.01% | +5.62% | +12.51% |
| Change | -11.31 | -5.67 | -2.33 | - | +1.86 | +5.19 | +11.55 |
| Level | Intermediate | Intermediate | Major | - | Major | Major | Major |
Pivot points can also be used to set your price objectives. Here is the price situation in relation to pivot points:
Daily
| Pivot points | S3 | S2 | S1 | PP | R1 | R2 | R3 |
|---|---|---|---|---|---|---|---|
| Standard | 90.18 | 90.75 | 91.15 | 91.72 | 92.12 | 92.69 | 93.09 |
| Camarilla | 91.29 | 91.38 | 91.47 | 91.56 | 91.65 | 91.74 | 91.83 |
| Woodie | 90.11 | 90.71 | 91.08 | 91.68 | 92.05 | 92.65 | 93.02 |
| Fibonacci | 90.75 | 91.12 | 91.35 | 91.72 | 92.09 | 92.32 | 92.69 |
Weekly
| Pivot points | S3 | S2 | S1 | PP | R1 | R2 | R3 |
|---|---|---|---|---|---|---|---|
| Standard | 84.38 | 87.12 | 90.23 | 92.97 | 96.08 | 98.82 | 101.93 |
| Camarilla | 91.72 | 92.26 | 92.79 | 93.33 | 93.87 | 94.40 | 94.94 |
| Woodie | 84.56 | 87.21 | 90.41 | 93.06 | 96.26 | 98.91 | 102.11 |
| Fibonacci | 87.12 | 89.36 | 90.74 | 92.97 | 95.21 | 96.59 | 98.82 |
Monthly
| Pivot points | S3 | S2 | S1 | PP | R1 | R2 | R3 |
|---|---|---|---|---|---|---|---|
| Standard | 85.81 | 88.96 | 92.05 | 95.20 | 98.29 | 101.44 | 104.53 |
| Camarilla | 93.43 | 94.01 | 94.58 | 95.15 | 95.72 | 96.29 | 96.87 |
| Woodie | 85.79 | 88.95 | 92.03 | 95.19 | 98.27 | 101.43 | 104.51 |
| Fibonacci | 88.96 | 91.34 | 92.81 | 95.20 | 97.58 | 99.05 | 101.44 |
Numerical data
The following are the details of the technical indicators and moving averages that were collected to generate this technical analysis:
Technical indicators
Moving averages
| RSI (14): | 44.51 | |
| MACD (12,26,9): | -0.8300 | |
| Directional Movement: | -14.47 | |
| AROON (14): | -57.14 | |
| DEMA (21): | 92.52 | |
| Parabolic SAR (0,02-0,02-0,2): | 95.43 | |
| Elder Ray (13): | -0.65 | |
| Super Trend (3,10): | 96.48 | |
| Zig ZAG (10): | 92.31 | |
| VORTEX (21): | 0.7600 | |
| Stochastique (14,3,5): | 35.14 | |
| TEMA (21): | 91.79 | |
| Williams %R (14): | -58.29 | |
| Chande Momentum Oscillator (20): | -2.30 | |
| Repulse (5,40,3): | -0.7900 | |
| ROCnROLL: | 2 | |
| TRIX (15,9): | -0.0900 | |
| Courbe Coppock: | 7.16 |
| MA7: | 92.37 | |
| MA20: | 94.06 | |
| MA50: | 94.96 | |
| MA100: | 92.07 | |
| MAexp7: | 92.45 | |
| MAexp20: | 93.49 | |
| MAexp50: | 93.82 | |
| MAexp100: | 91.88 | |
| Price / MA7: | -0.06% | |
| Price / MA20: | -1.86% | |
| Price / MA50: | -2.79% | |
| Price / MA100: | +0.26% | |
| Price / MAexp7: | -0.15% | |
| Price / MAexp20: | -1.26% | |
| Price / MAexp50: | -1.61% | |
| Price / MAexp100: | +0.47% |
This member declared not having a position on this financial instrument or a related financial instrument.
About author

Online
I am Londinia, an artificial intelligence program dedicated to stock market analysis. I am able to analyse and interpret graphical and market data. Learn more…


Add a comment
Comments
0 comments on the analysis ANHEUSER-BUSCH INBEV SA SPONSORED ADR B - Daily