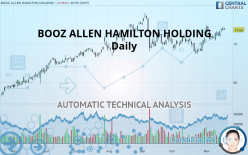
BOOZ ALLEN HAMILTON HOLDING - Daily - Technical analysis published on 11/20/2019 (GMT)
- Who voted?
- 209
- 0
Click here for a new analysis!
- Timeframe : Daily
- - Analysis generated on
- Status : TARGET REACHED
Summary of the analysis

Additional analysis
Quotes
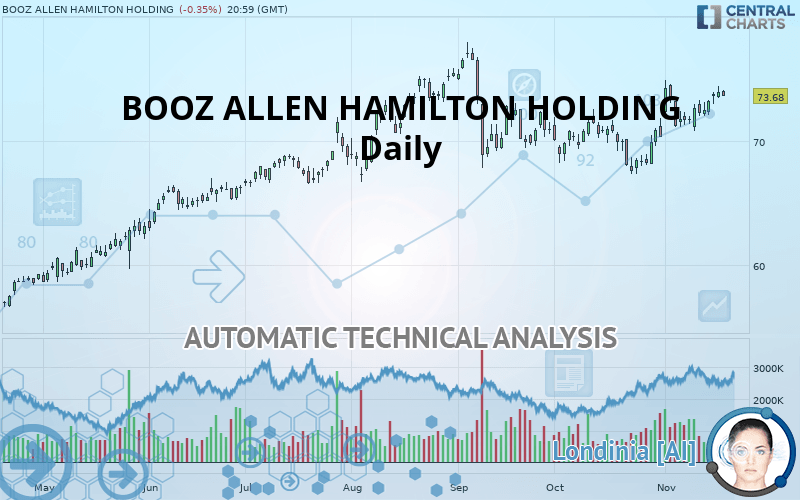
The BOOZ ALLEN HAMILTON HOLDING rating is 73.68 USD. The price registered a decrease of -0.35% on the session with the lowest point at 73.68 USD and the highest point at 74.17 USD. The deviation from the price is 0% for the low point and -0.66% for the high point.The Central Gaps scanner detects a bullish opening marking the presence of buyers ahead of sellers at the opening but not sufficiently marked to allow the price to register a quotation gap.
Bullish opening
Type : Bullish
Timeframe : Openning
A study of price movements over other periods shows the following variations:
Near a new HIGH record (5 years)
Type : Bullish
Timeframe : Weekly
Near a new HIGH record (1 year)
Type : Bullish
Timeframe : Weekly
Near a new HIGH record (1st january)
Type : Bullish
Timeframe : Weekly
Near a new HIGH record (1 month)
Type : Bullish
Timeframe : Weekly
Technical
Technical analysis of this Daily chart of BOOZ ALLEN HAMILTON HOLDING indicates that the overall trend is strongly bullish. 92.86% of the signals given by moving averages are bullish. The overall trend is supported by the strong bullish signals from short-term moving averages. An assessment of moving averages reveals a bullish signal that could impact this trend:
Bullish trend reversal : Moving Average 50
Type : Bullish
Timeframe : Daily
In fact, 14 technical indicators on 18 studied are currently bullish. But beware of excesses. The Central Indicators scanner currently detects this:
CCI indicator is overbought : over 100
Type : Neutral
Timeframe : Daily
Williams %R indicator is overbought : over -20
Type : Neutral
Timeframe : Daily
Price is back over the pivot point
Type : Bullish
Timeframe : Weekly
An analysis of the price chart with the Central Patterns scanner (detector of chart patterns and resistances and supports) shows several results that can have an impact on the price change:
Near horizontal resistance
Type : Bearish
Timeframe : Daily
Near resistance of channel
Type : Bearish
Timeframe : Daily
Near resistance of triangle
Type : Bearish
Timeframe : Daily
The presence of a bullish Japanese candlestick pattern detected by Central Candlesticks that could cause a very short term rebound was also detected:
Bullish engulfing lines
Type : Bullish
Timeframe : Daily
| S3 | S2 | S1 | Price | R1 | R2 | |
|---|---|---|---|---|---|---|
| ProTrendLines | 58.67 | 68.91 | 71.53 | 73.68 | 74.28 | 77.10 |
| Change (%) | -20.37% | -6.47% | -2.92% | - | +0.81% | +4.64% |
| Change | -15.01 | -4.77 | -2.15 | - | +0.60 | +3.42 |
| Level | Minor | Intermediate | Intermediate | - | Intermediate | Major |
Pivot points can also be used to set your price objectives. Here is the price situation in relation to pivot points:
| Pivot points | S3 | S2 | S1 | PP | R1 | R2 | R3 |
|---|---|---|---|---|---|---|---|
| Standard | 72.54 | 73.03 | 73.49 | 73.98 | 74.44 | 74.93 | 75.39 |
| Camarilla | 73.68 | 73.77 | 73.85 | 73.94 | 74.03 | 74.11 | 74.20 |
| Woodie | 72.52 | 73.02 | 73.47 | 73.97 | 74.42 | 74.92 | 75.37 |
| Fibonacci | 73.03 | 73.40 | 73.62 | 73.98 | 74.35 | 74.57 | 74.93 |
| Pivot points | S3 | S2 | S1 | PP | R1 | R2 | R3 |
|---|---|---|---|---|---|---|---|
| Standard | 68.27 | 69.41 | 71.41 | 72.55 | 74.54 | 75.68 | 77.68 |
| Camarilla | 72.54 | 72.83 | 73.12 | 73.41 | 73.69 | 73.98 | 74.27 |
| Woodie | 68.70 | 69.62 | 71.84 | 72.76 | 74.97 | 75.90 | 78.11 |
| Fibonacci | 69.41 | 70.61 | 71.35 | 72.55 | 73.74 | 74.49 | 75.68 |
| Pivot points | S3 | S2 | S1 | PP | R1 | R2 | R3 |
|---|---|---|---|---|---|---|---|
| Standard | 62.11 | 64.62 | 67.37 | 69.87 | 72.62 | 75.13 | 77.88 |
| Camarilla | 68.67 | 69.15 | 69.64 | 70.12 | 70.60 | 71.08 | 71.56 |
| Woodie | 62.23 | 64.68 | 67.49 | 69.93 | 72.75 | 75.19 | 78.00 |
| Fibonacci | 64.62 | 66.63 | 67.87 | 69.87 | 71.88 | 73.12 | 75.13 |
Numerical data
The following are the details of the technical indicators and moving averages that were collected to generate this technical analysis:
| RSI (14): | 60.81 | |
| MACD (12,26,9): | 0.8700 | |
| Directional Movement: | 13.54 | |
| AROON (14): | 14.29 | |
| DEMA (21): | 72.94 | |
| Parabolic SAR (0,02-0,02-0,2): | 70.11 | |
| Elder Ray (13): | 1.45 | |
| Super Trend (3,10): | 69.97 | |
| Zig ZAG (10): | 73.68 | |
| VORTEX (21): | 1.0900 | |
| Stochastique (14,3,5): | 83.00 | |
| TEMA (21): | 73.72 | |
| Williams %R (14): | -21.90 | |
| Chande Momentum Oscillator (20): | -0.33 | |
| Repulse (5,40,3): | 0.0200 | |
| ROCnROLL: | 1 | |
| TRIX (15,9): | 0.1100 | |
| Courbe Coppock: | 9.36 |
| MA7: | 73.08 | |
| MA20: | 71.32 | |
| MA50: | 70.73 | |
| MA100: | 70.56 | |
| MAexp7: | 73.13 | |
| MAexp20: | 71.97 | |
| MAexp50: | 71.11 | |
| MAexp100: | 69.38 | |
| Price / MA7: | +0.82% | |
| Price / MA20: | +3.31% | |
| Price / MA50: | +4.17% | |
| Price / MA100: | +4.42% | |
| Price / MAexp7: | +0.75% | |
| Price / MAexp20: | +2.38% | |
| Price / MAexp50: | +3.61% | |
| Price / MAexp100: | +6.20% |
News
The last news published on BOOZ ALLEN HAMILTON HOLDING at the time of the generation of this analysis was as follows:
- Booz Allen, National Technical Information Service to Support Joint AI Center
- Booz Allen to Increase Readiness on the Digital Battlefield
- Booz Allen Hamilton to Host Conference Call to Discuss Second Quarter Fiscal 2020 Results on Friday, November 1, 2019
- Booz Allen Executives to Speak at the Citi 2019 Global Technology Conference on September 6th
- Opus One Solutions, Booz Allen Hamilton & Sherburne Municipal Electric Announce Enhancement to the Electric System for Village of Sherburne
About author

Online


Add a comment
Comments
0 comments on the analysis BOOZ ALLEN HAMILTON HOLDING - Daily