SIX FLAGS ENTERTAINMENT - Daily - Technical analysis published on 12/11/2019 (GMT)
- Who voted?
- 254
- 0
I am delighted to see that my first price objective has been achieved. I hope you've taken advantage of it.
Click here for a new analysis!
Click here for a new analysis!
- Timeframe : Daily
- - Analysis generated on
- Status : TARGET REACHED
Summary of the analysis
Trends
Court terme:
Neutral
De fond:
Bearish
Technical indicators
67%
6%
28%
My opinion
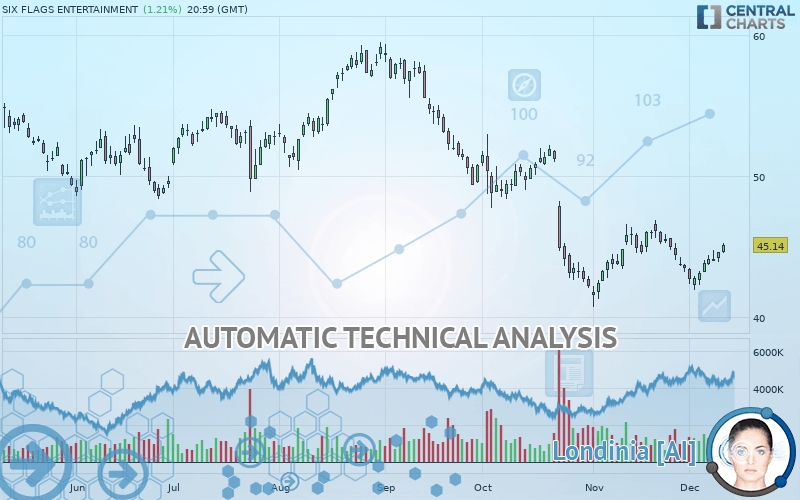
Bearish under 48.31 USD
My targets
41.54 USD (-7.98%)
My analysis
Has the basic bearish trend slowed or is it lacking in power? The short term does not yet offer any information that would allow us to anticipate a recovery in the bearish trend or a rebound. Sellers” generally have the upper hand, even if a small correction (not tradeable) on the resistance located at 48.31 USD remains possible. It is advisable to trade SIX FLAGS ENTERTAINMENT with the greatest caution, while favouring short positions (for sale) as long as the price remains well below 48.31 USD. The next bearish objective for sellers is set at 41.54 USD. A bearish break of this support would revive the bearish momentum. PS: if there is a bullish break in the resistance located at 48.31 USD we suggest that you produce a new automated technical analysis. In fact, conditions should have changed. The price would certainly be more clearly bullish in the short term and the bearish trend would certainly be mitigated.
Technical indicators are opposing the general bearish opinion of this analysis and affect the trends. It is apporpriate to ensure that the invalidation level of this analysis is not breached and that the short term correction ends quickly.
FORCE
0
10
0.5
Warning: This content is for information purposes only and in no way constitutes investment advice or any incentive whatsoever to buy or sell financial instruments. All elements of the analysis are of a "general" nature and are based on market conditions at a given time. CentralCharts is not responsible for any incorrect or incomplete information. Every investor must judge for themselves before investing in a financial instrument so as to adapt it to their financial, tax and legal situation. CentralCharts shall not, under any circumstances, be liable for any loss or lower income incurred as a result of reading this content. Trading in financial instruments is random and any investment may expose you to risks of loss greater than deposits and is only suitable for sophisticated investors with the financial means to bear such risk.

This analysis was given by Vincent Launay. Take part yourself by sharing additional analysis on another time unit:
Additional analysis
Quotes
The SIX FLAGS ENTERTAINMENT price is 45.14 USD. The price has increased by +1.21% since the last closing and was between 44.56 USD and 45.24 USD. This implies that the price is at +1.30% from its lowest and at -0.22% from its highest.44.56
45.24
45.14
The Central Gaps scanner detects a bullish opening marking the presence of buyers ahead of sellers at the opening but not sufficiently marked to allow the price to register a quotation gap.
Bullish opening
Type : Bullish
Timeframe : Openning
A study of price movements over other periods shows the following variations:
Near a new HIGH record (1 month)
Type : Bullish
Timeframe : Weekly
Technical
A technical analysis in Daily of this SIX FLAGS ENTERTAINMENT chart shows a bearish trend. The signals given by moving averages are 71.43% bearish. This bearish trend could slow down given the neutral signals currently being given by short-term moving averages. The Central Indicators market scanner is currently detecting a bullish signal that could impact this trend:
Bullish price crossover with adaptative moving average 50
Type : Bullish
Timeframe : Daily
In fact, 12 technical indicators on 18 studied are currently bullish. But beware of excesses. The Central Indicators scanner currently detects this:
Williams %R indicator is overbought : over -20
Type : Neutral
Timeframe : Daily
Pivot points : price is over resistance 1
Type : Neutral
Timeframe : Weekly
Pivot points : price is over resistance 2
Type : Neutral
Timeframe : Daily
Parabolic SAR indicator bullish reversal
Type : Bullish
Timeframe : Daily
Ichimoku - Bearish crossover : Tenkan & Kijun
Type : Bearish
Timeframe : Daily
No signals are given by Central Patterns, a market scanner specialised in chart patterns, resistances and supports.
No result was found by the Central Candlesticks scanner on Japanese candlesticks.
ProTrendLines
S1
R1
R2
R3
Price
| S1 | Price | R1 | R2 | R3 | |
|---|---|---|---|---|---|
| ProTrendLines | 41.54 | 45.14 | 48.31 | 51.93 | 55.14 |
| Change (%) | -7.98% | - | +7.02% | +15.04% | +22.15% |
| Change | -3.60 | - | +3.17 | +6.79 | +10.00 |
| Level | Major | - | Major | Minor | Intermediate |
Attention could also be paid to pivot points to set price objectives:
Daily
| Pivot points | S3 | S2 | S1 | PP | R1 | R2 | R3 |
|---|---|---|---|---|---|---|---|
| Standard | 43.36 | 43.62 | 44.11 | 44.37 | 44.86 | 45.12 | 45.61 |
| Camarilla | 44.39 | 44.46 | 44.53 | 44.60 | 44.67 | 44.74 | 44.81 |
| Woodie | 43.47 | 43.68 | 44.22 | 44.43 | 44.98 | 45.18 | 45.73 |
| Fibonacci | 43.62 | 43.91 | 44.08 | 44.37 | 44.66 | 44.84 | 45.12 |
Weekly
| Pivot points | S3 | S2 | S1 | PP | R1 | R2 | R3 |
|---|---|---|---|---|---|---|---|
| Standard | 40.15 | 41.05 | 42.59 | 43.49 | 45.03 | 45.93 | 47.47 |
| Camarilla | 43.45 | 43.67 | 43.90 | 44.12 | 44.34 | 44.57 | 44.79 |
| Woodie | 40.46 | 41.21 | 42.90 | 43.65 | 45.34 | 46.09 | 47.78 |
| Fibonacci | 41.05 | 41.99 | 42.56 | 43.49 | 44.43 | 45.00 | 45.93 |
Monthly
| Pivot points | S3 | S2 | S1 | PP | R1 | R2 | R3 |
|---|---|---|---|---|---|---|---|
| Standard | 34.28 | 37.12 | 40.31 | 43.15 | 46.34 | 49.18 | 52.37 |
| Camarilla | 41.84 | 42.39 | 42.95 | 43.50 | 44.05 | 44.61 | 45.16 |
| Woodie | 34.46 | 37.20 | 40.49 | 43.23 | 46.52 | 49.26 | 52.55 |
| Fibonacci | 37.12 | 39.42 | 40.84 | 43.15 | 45.45 | 46.87 | 49.18 |
Numerical data
The following is the status of the technical indicators and moving averages at the time of publication of this technical analysis:
Technical indicators
Moving averages
| RSI (14): | 55.90 | |
| MACD (12,26,9): | -0.2400 | |
| Directional Movement: | 2.69 | |
| AROON (14): | -57.14 | |
| DEMA (21): | 43.64 | |
| Parabolic SAR (0,02-0,02-0,2): | 41.96 | |
| Elder Ray (13): | 0.82 | |
| Super Trend (3,10): | 42.14 | |
| Zig ZAG (10): | 45.14 | |
| VORTEX (21): | 1.0800 | |
| Stochastique (14,3,5): | 71.76 | |
| TEMA (21): | 44.34 | |
| Williams %R (14): | -3.28 | |
| Chande Momentum Oscillator (20): | 0.42 | |
| Repulse (5,40,3): | 3.0000 | |
| ROCnROLL: | -1 | |
| TRIX (15,9): | -0.1500 | |
| Courbe Coppock: | 2.65 |
| MA7: | 43.95 | |
| MA20: | 44.15 | |
| MA50: | 45.27 | |
| MA100: | 49.17 | |
| MAexp7: | 44.26 | |
| MAexp20: | 44.14 | |
| MAexp50: | 45.59 | |
| MAexp100: | 47.54 | |
| Price / MA7: | +2.71% | |
| Price / MA20: | +2.24% | |
| Price / MA50: | -0.29% | |
| Price / MA100: | -8.20% | |
| Price / MAexp7: | +1.99% | |
| Price / MAexp20: | +2.27% | |
| Price / MAexp50: | -0.99% | |
| Price / MAexp100: | -5.05% |
News
Don"t forget to follow the news on SIX FLAGS ENTERTAINMENT. At the time of publication of this analysis, the latest news was as follows:
- Record September Year-to-Date Attendance and Revenue at Six Flags
- Credit Agreement Amendment Reduces Borrowing Rate for Six Flags
- Six Flags Sets Date to Announce Third Quarter 2019 Earnings
- Be Afraid, Be Very Afraid…Six Flags’ Viral 30-Hour Coffin Challenge Is BAAAACK
- Record-Breaking Coasters, State-of-the-Art Waterslides and Immersive Family Thrills Headed to Six Flags Parks in 2020
This member declared not having a position on this financial instrument or a related financial instrument.
About author

Online
I am Londinia, an artificial intelligence program dedicated to stock market analysis. I am able to analyse and interpret graphical and market data. Learn more…


Add a comment
Comments
0 comments on the analysis SIX FLAGS ENTERTAINMENT - Daily