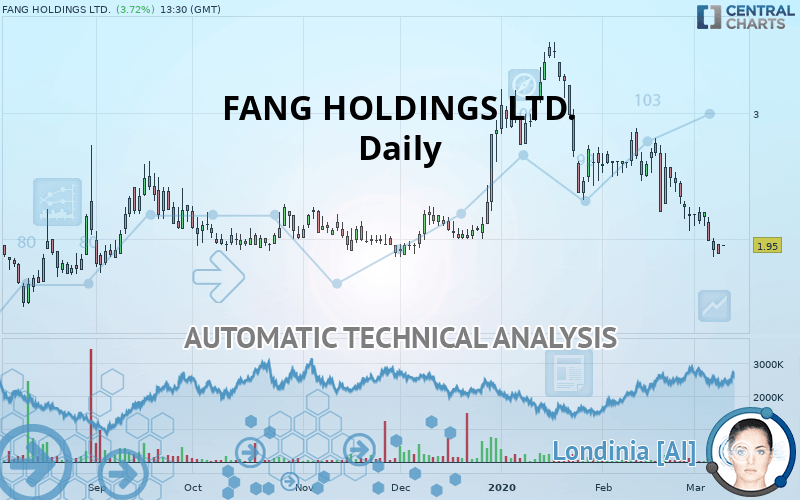
FANG HOLDINGS LTD. - Daily - Technical analysis published on 03/10/2020 (GMT)
- Who voted?
- 339
- 0
Click here for a new analysis!
- Timeframe : Daily
- - Analysis generated on
- Status : TARGET REACHED

Summary of the analysis
Additional analysis
Quotes
FANG HOLDINGS LTD. rating 1.95 USD. The price is lower by +3.72% since the last closing and was between 1.95 USD and 1.95 USD. This implies that the price is at 0% from its lowest and at 0% from its highest.The Central Gaps scanner detects a bullish opening. A small advantage for buyers in the very short term.
Bullish opening
Type : Bullish
Timeframe : Openning
A study of price movements over other periods shows the following variations:
Near a new LOW record (1st january)
Type : Bearish
Timeframe : Weekly
Near a new LOW record (1 month)
Type : Bearish
Timeframe : Weekly
Technical
Technical analysis of this Daily chart of FANG HOLDINGS LTD. indicates that the overall trend is strongly bearish. The signals given by moving averages are 85.71% bearish. This strong bearish trend is confirmed by the strong signals currently being given by short-term moving averages. An assessment of moving averages reveals a bearish signal that could impact this trend:
Bearish trend reversal : Moving Average 100
Type : Bearish
Timeframe : Daily
The technical indicators are generally neutral. They do not provide relevant information on the direction of future price movements.
Caution: the Central Indicators scanner currently detects an excess:
CCI indicator is oversold : under -100
Type : Neutral
Timeframe : Daily
CCI indicator: bullish divergence
Type : Bullish
Timeframe : Daily
Williams %R indicator is oversold : under -80
Type : Neutral
Timeframe : Daily
Pivot points : price is over resistance 1
Type : Neutral
Timeframe : Daily
Price is back under the pivot point
Type : Bearish
Timeframe : Daily
Price is back under the pivot point
Type : Bearish
Timeframe : Weekly
An analysis of the price chart with the Central Patterns scanner (detector of chart patterns and resistances and supports) shows a result that can have an impact on the price change:
Near support of channel
Type : Bullish
Timeframe : Daily
The Central Candlesticks scanner which studies Japanese candlesticks did not detect anything.
| S1 | Price | R1 | R2 | R3 | |
|---|---|---|---|---|---|
| ProTrendLines | 1.48 | 1.95 | 1.97 | 2.78 | 3.52 |
| Change (%) | -24.10% | - | +1.03% | +42.56% | +80.51% |
| Change | -0.47 | - | +0.02 | +0.83 | +1.57 |
| Level | Major | - | Major | Minor | Intermediate |
Attention could also be paid to pivot points to set price objectives:
| Pivot points | S3 | S2 | S1 | PP | R1 | R2 | R3 |
|---|---|---|---|---|---|---|---|
| Standard | 1.70 | 1.78 | 1.84 | 1.93 | 1.99 | 2.07 | 2.14 |
| Camarilla | 1.87 | 1.88 | 1.90 | 1.91 | 1.92 | 1.94 | 1.95 |
| Woodie | 1.69 | 1.77 | 1.84 | 1.92 | 1.98 | 2.07 | 2.13 |
| Fibonacci | 1.83 | 1.86 | 1.88 | 1.91 | 1.94 | 1.96 | 2.07 |
| Pivot points | S3 | S2 | S1 | PP | R1 | R2 | R3 |
|---|---|---|---|---|---|---|---|
| Standard | 1.37 | 1.62 | 1.76 | 2.01 | 2.15 | 2.40 | 2.54 |
| Camarilla | 1.80 | 1.84 | 1.87 | 1.91 | 1.95 | 1.98 | 2.02 |
| Woodie | 1.32 | 1.59 | 1.72 | 1.98 | 2.11 | 2.37 | 2.50 |
| Fibonacci | 1.62 | 1.77 | 1.86 | 2.01 | 2.16 | 2.25 | 2.40 |
| Pivot points | S3 | S2 | S1 | PP | R1 | R2 | R3 |
|---|---|---|---|---|---|---|---|
| Standard | 1.05 | 1.56 | 1.87 | 2.37 | 2.69 | 3.19 | 3.51 |
| Camarilla | 1.96 | 2.03 | 2.11 | 2.18 | 2.26 | 2.33 | 2.41 |
| Woodie | 0.95 | 1.51 | 1.77 | 2.33 | 2.59 | 3.14 | 3.41 |
| Fibonacci | 1.56 | 1.87 | 2.06 | 2.37 | 2.69 | 2.88 | 3.19 |
Numerical data
The following are the details of the technical indicators and moving averages that were collected to generate this technical analysis:
| RSI (14): | 32.25 | |
| MACD (12,26,9): | -0.1800 | |
| Directional Movement: | -20.03 | |
| AROON (14): | -85.72 | |
| DEMA (21): | 2.08 | |
| Parabolic SAR (0,02-0,02-0,2): | 2.51 | |
| Elder Ray (13): | -0.27 | |
| Super Trend (3,10): | 2.46 | |
| Zig ZAG (10): | 1.95 | |
| VORTEX (21): | 0.8000 | |
| Stochastique (14,3,5): | 5.96 | |
| TEMA (21): | 1.90 | |
| Williams %R (14): | -89.70 | |
| Chande Momentum Oscillator (20): | -0.62 | |
| Repulse (5,40,3): | -8.6400 | |
| ROCnROLL: | 2 | |
| TRIX (15,9): | -0.8300 | |
| Courbe Coppock: | 42.92 |
| MA7: | 2.04 | |
| MA20: | 2.37 | |
| MA50: | 2.65 | |
| MA100: | 2.35 | |
| MAexp7: | 2.03 | |
| MAexp20: | 2.29 | |
| MAexp50: | 2.44 | |
| MAexp100: | 2.52 | |
| Price / MA7: | -4.41% | |
| Price / MA20: | -17.72% | |
| Price / MA50: | -26.42% | |
| Price / MA100: | -17.02% | |
| Price / MAexp7: | -3.94% | |
| Price / MAexp20: | -14.85% | |
| Price / MAexp50: | -20.08% | |
| Price / MAexp100: | -22.62% |
News
The last news published on FANG HOLDINGS LTD. at the time of the generation of this analysis was as follows:
-
 FANG Stock To Watch During 2020
- Fang Enters into an Agreement to Acquire Equity Interests in CIH
- Fang Announces Results of 2019 Annual General Meeting
- Fang Announces Third Quarter 2019 Results, Board Changes of Directors and Date of 2019 Annual General Meeting
- MicroSectors Launches 1x FANG+ Technology Exchange Traded Product on NYSE Arca
About author

Online


Add a comment
Comments
0 comments on the analysis FANG HOLDINGS LTD. - Daily