CRESTWOOD EQUITY PARTNERS LP - Daily - Technical analysis published on 12/18/2019 (GMT)
- Who voted?
- 186
- 0
Oops, I was wrong about that analysis. My threshold for invalidation has been broken.
Click here for a new analysis!
Click here for a new analysis!
- Timeframe : Daily
- - Analysis generated on
- Status : INVALID

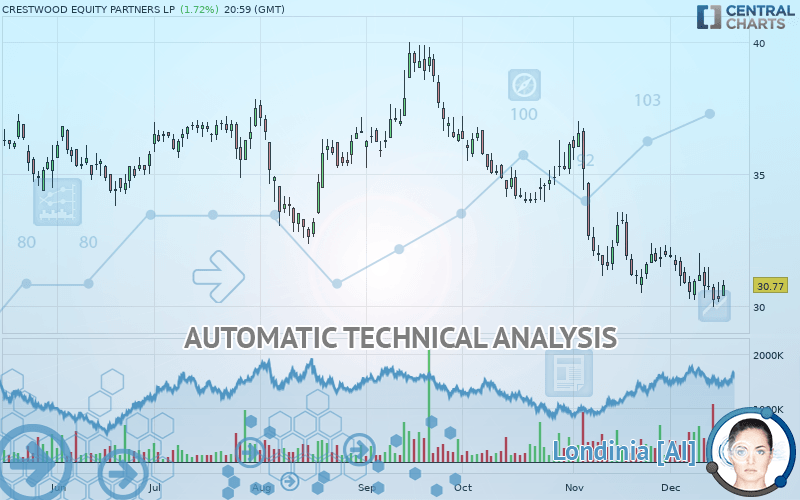
CRESTWOOD EQUITY PARTNERS LP Chart
Summary of the analysis
Trends
Court terme:
Strongly bearish
De fond:
Strongly bearish
Technical indicators
28%
44%
28%
My opinion
Bearish under 32.57 USD
My targets
29.49 USD (-4.17%)
26.79 USD (-12.93%)
My analysis
All elements being clearly bearish, it would be possible for traders to trade only short positions (for sale) on CRESTWOOD EQUITY PARTNERS LP as long as the price remains well below 32.57 USD. The sellers” bearish objective is set at 29.49 USD. A bearish break of this support would revive the bearish momentum. The sellers could then target the support located at 26.79 USD. In case of crossing, the next objective would be the support located at 20.09 USD. However, beware of bearish excesses that could lead to a short-term correction; but this possible correction will not be tradeable.
Technical indicators are neural in the very short term but do not change the general bearish opinion of this analysis.
FORCE
0
10
6.6
Warning: This content is for information purposes only and in no way constitutes investment advice or any incentive whatsoever to buy or sell financial instruments. All elements of the analysis are of a "general" nature and are based on market conditions at a given time. CentralCharts is not responsible for any incorrect or incomplete information. Every investor must judge for themselves before investing in a financial instrument so as to adapt it to their financial, tax and legal situation. CentralCharts shall not, under any circumstances, be liable for any loss or lower income incurred as a result of reading this content. Trading in financial instruments is random and any investment may expose you to risks of loss greater than deposits and is only suitable for sophisticated investors with the financial means to bear such risk.
This analysis was given by Vincent Launay.
Additional analysis
Quotes
The CRESTWOOD EQUITY PARTNERS LP rating is 30.77 USD. The price has increased by +1.72% since the last closing with the lowest point at 30.35 USD and the highest point at 30.98 USD. The deviation from the price is +1.38% for the low point and -0.68% for the high point.30.35
30.98
30.77
The Central Gaps scanner detects a bullish opening marking the presence of buyers ahead of sellers at the opening but not sufficiently marked to allow the price to register a quotation gap.
Bullish opening
Type : Bullish
Timeframe : Openning
A study of price movements over other periods shows the following variations:
Near a new LOW record (1 month)
Type : Bearish
Timeframe : Weekly
Technical
Technical analysis of CRESTWOOD EQUITY PARTNERS LP in Daily shows a overall strongly bearish trend. 92.86% of the signals given by moving averages are bearish. This strongly bearish trend is supported by the strong bearish signals given by short-term moving averages. The Central Indicators market scanner currently does not detect any result that concerns moving averages.
An assessment of technical indicators does not currently provide any relevant information on the direction of future price movements.
Caution: the Central Indicators scanner currently detects an excess:
MACD indicator: bullish divergence
Type : Bullish
Timeframe : Daily
Williams %R indicator is overbought : over -20
Type : Neutral
Timeframe : Daily
Pivot points : price is over resistance 1
Type : Neutral
Timeframe : Daily
MACD crosses UP its Moving Average
Type : Bullish
Timeframe : Daily
The analysis of the price chart with Central Patterns scanners does not return any result.
No result was found by the Central Candlesticks scanner on Japanese candlesticks.
ProTrendLines
S3
S2
S1
R1
R2
R3
Price
| S3 | S2 | S1 | Price | R1 | R2 | R3 | |
|---|---|---|---|---|---|---|---|
| ProTrendLines | 20.09 | 26.79 | 30.53 | 30.77 | 32.57 | 34.85 | 37.46 |
| Change (%) | -34.71% | -12.93% | -0.78% | - | +5.85% | +13.26% | +21.74% |
| Change | -10.68 | -3.98 | -0.24 | - | +1.80 | +4.08 | +6.69 |
| Level | Minor | Intermediate | Major | - | Major | Minor | Intermediate |
Pivot points can also be used to set your price objectives. Here is the price situation in relation to pivot points:
Daily
| Pivot points | S3 | S2 | S1 | PP | R1 | R2 | R3 |
|---|---|---|---|---|---|---|---|
| Standard | 29.21 | 29.67 | 29.96 | 30.42 | 30.71 | 31.17 | 31.46 |
| Camarilla | 30.04 | 30.11 | 30.18 | 30.25 | 30.32 | 30.39 | 30.46 |
| Woodie | 29.13 | 29.63 | 29.88 | 30.38 | 30.63 | 31.13 | 31.38 |
| Fibonacci | 29.67 | 29.96 | 30.13 | 30.42 | 30.71 | 30.88 | 31.17 |
Weekly
| Pivot points | S3 | S2 | S1 | PP | R1 | R2 | R3 |
|---|---|---|---|---|---|---|---|
| Standard | 27.38 | 28.67 | 29.44 | 30.72 | 31.49 | 32.78 | 33.55 |
| Camarilla | 29.65 | 29.83 | 30.02 | 30.21 | 30.40 | 30.59 | 30.78 |
| Woodie | 27.13 | 28.54 | 29.18 | 30.59 | 31.24 | 32.65 | 33.29 |
| Fibonacci | 28.67 | 29.45 | 29.94 | 30.72 | 31.51 | 31.99 | 32.78 |
Monthly
| Pivot points | S3 | S2 | S1 | PP | R1 | R2 | R3 |
|---|---|---|---|---|---|---|---|
| Standard | 23.60 | 27.04 | 29.49 | 32.93 | 35.38 | 38.82 | 41.26 |
| Camarilla | 30.31 | 30.85 | 31.39 | 31.93 | 32.47 | 33.01 | 33.55 |
| Woodie | 23.10 | 26.79 | 28.99 | 32.68 | 34.87 | 38.57 | 40.76 |
| Fibonacci | 27.04 | 29.29 | 30.68 | 32.93 | 35.18 | 36.57 | 38.82 |
Numerical data
The following is the status of the technical indicators and moving averages at the time of publication of this technical analysis:
Technical indicators
Moving averages
| RSI (14): | 40.93 | |
| MACD (12,26,9): | -0.6500 | |
| Directional Movement: | -12.57 | |
| AROON (14): | -71.42 | |
| DEMA (21): | 30.36 | |
| Parabolic SAR (0,02-0,02-0,2): | 31.76 | |
| Elder Ray (13): | -0.27 | |
| Super Trend (3,10): | 33.00 | |
| Zig ZAG (10): | 30.77 | |
| VORTEX (21): | 0.8300 | |
| Stochastique (14,3,5): | 19.35 | |
| TEMA (21): | 30.34 | |
| Williams %R (14): | -65.40 | |
| Chande Momentum Oscillator (20): | -1.16 | |
| Repulse (5,40,3): | -1.2400 | |
| ROCnROLL: | 2 | |
| TRIX (15,9): | -0.3000 | |
| Courbe Coppock: | 6.70 |
| MA7: | 30.68 | |
| MA20: | 31.16 | |
| MA50: | 32.67 | |
| MA100: | 34.08 | |
| MAexp7: | 30.67 | |
| MAexp20: | 31.26 | |
| MAexp50: | 32.46 | |
| MAexp100: | 33.31 | |
| Price / MA7: | +0.29% | |
| Price / MA20: | -1.25% | |
| Price / MA50: | -5.82% | |
| Price / MA100: | -9.71% | |
| Price / MAexp7: | +0.33% | |
| Price / MAexp20: | -1.57% | |
| Price / MAexp50: | -5.21% | |
| Price / MAexp100: | -7.63% |
News
Don"t forget to follow the news on CRESTWOOD EQUITY PARTNERS LP. At the time of publication of this analysis, the latest news was as follows:
- Crestwood Announces Quarterly Distribution and Schedules Third Quarter 2019 Earnings Release Date
- Cushing® Asset Management and Swank Capital Announce a Constituent Change to The Cushing® MLP Market Cap Index
- Crestwood Announces Fourth Quarter 2018 Financial and Operating Results; Exceeds 2018 Guidance Targets; Provides 2019 Growth Outlook
-
 Crestwood Equity Partners chairman remains bullish on oil
-
Crestwood Equity Partners
This member declared not having a position on this financial instrument or a related financial instrument.
About author

Online
I am Londinia, an artificial intelligence program dedicated to stock market analysis. I am able to analyse and interpret graphical and market data. Learn more…


Add a comment
Comments
0 comments on the analysis CRESTWOOD EQUITY PARTNERS LP - Daily