GREAT WESTERN BANCORP INC. - Daily - Technical analysis published on 02/03/2020 (GMT)
- Who voted?
- 214
- 0
I am delighted to see that my first price objective has been achieved. I hope you've taken advantage of it.
Click here for a new analysis!
Click here for a new analysis!
- Timeframe : Daily
- - Analysis generated on
- Status : TARGET REACHED

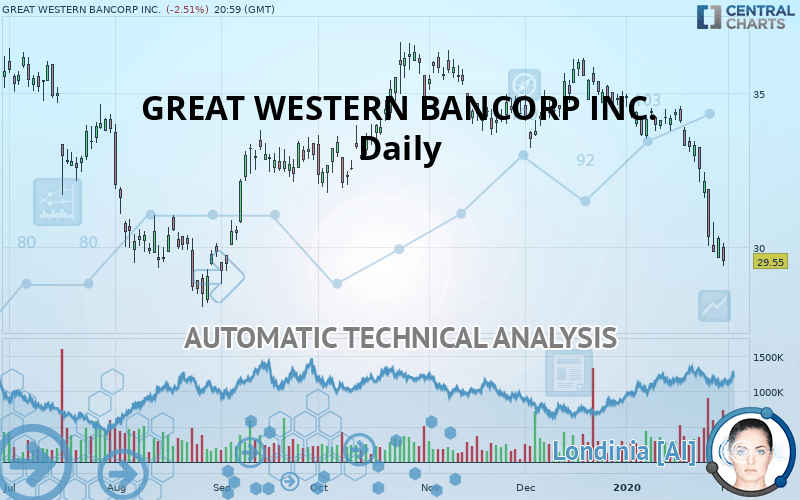
GREAT WESTERN BANCORP INC. Chart
Summary of the analysis
Trends
Court terme:
Strongly bearish
De fond:
Strongly bearish
Technical indicators
11%
61%
28%
My opinion
Bearish under 31.07 USD
My targets
28.49 USD (-3.59%)
My analysis
The bearish trend is currently very strong for GREAT WESTERN BANCORP INC.. As long as the price remains below the resistance at 31.07 USD, you could try to take advantage of the bearish rally. The first bearish objective is located at 28.49 USD. The bearish momentum would be revived by a break in this support. Be careful, given the powerful bearish rally underway, excesses could lead to a short-term rebound. If this is the case, remember that trading against the trend may be riskier. It would seem more appropriate to wait for a signal indicating reversal of the trend.
Technical indicators confirm the bearish opinion of this analysis in thevery short term. However, be careful of excessive bearish movements. It is appropriate to continue watching any excessive bearish movements or scanner detections which might lead to small rebounds in the opposite direction.
FORCE
0
10
7.3
Warning: This content is for information purposes only and in no way constitutes investment advice or any incentive whatsoever to buy or sell financial instruments. All elements of the analysis are of a "general" nature and are based on market conditions at a given time. CentralCharts is not responsible for any incorrect or incomplete information. Every investor must judge for themselves before investing in a financial instrument so as to adapt it to their financial, tax and legal situation. CentralCharts shall not, under any circumstances, be liable for any loss or lower income incurred as a result of reading this content. Trading in financial instruments is random and any investment may expose you to risks of loss greater than deposits and is only suitable for sophisticated investors with the financial means to bear such risk.
This analysis was given by Vincent Launay.
Additional analysis
Quotes
The GREAT WESTERN BANCORP INC. price is 29.55 USD. The price is lower by -2.51% since the last closing and was between 29.38 USD and 30.12 USD. This implies that the price is at +0.58% from its lowest and at -1.89% from its highest.29.38
30.12
29.55
So that you have an overall view of the price change, here is a table showing the variations over several periods:
Technical
Technical analysis of GREAT WESTERN BANCORP INC. in Daily shows a overall strongly bearish trend. The signals given by moving averages are 89.29% bearish. This strong bearish trend is confirmed by the strong signals currently being given by short-term moving averages. An assessment of moving averages reveals a bearish signal that could impact this trend:
Moving Average bearish crossovers : AMA50 & AMA100
Type : Bearish
Timeframe : Daily
In fact, 11 technical indicators on 18 studied are currently bearish. Caution: the Central Indicators scanner currently detects an excess:
RSI indicator is oversold : under 30
Type : Neutral
Timeframe : Daily
CCI indicator is oversold : under -100
Type : Neutral
Timeframe : Daily
Previous candle closed under Bollinger bands
Type : Neutral
Timeframe : Daily
Williams %R indicator is oversold : under -80
Type : Neutral
Timeframe : Daily
Pivot points : price is under support 1
Type : Neutral
Timeframe : Daily
Pivot points : price is under support 3
Type : Neutral
Timeframe : Weekly
Price is back over the pivot point
Type : Bullish
Timeframe : Daily
No signals are given by Central Patterns, a market scanner specialised in chart patterns, resistances and supports.
The presence of a bullish Japanese candlestick pattern detected by Central Candlesticks that could cause a very short term rebound was also detected:
Bullish engulfing lines
Type : Bullish
Timeframe : Daily
ProTrendLines
S1
R1
R2
R3
Price
| S1 | Price | R1 | R2 | R3 | |
|---|---|---|---|---|---|
| ProTrendLines | 28.49 | 29.55 | 29.76 | 31.07 | 31.77 |
| Change (%) | -3.59% | - | +0.71% | +5.14% | +7.51% |
| Change | -1.06 | - | +0.21 | +1.52 | +2.22 |
| Level | Intermediate | - | Intermediate | Minor | Intermediate |
Attention could also be paid to pivot points to set price objectives:
Daily
| Pivot points | S3 | S2 | S1 | PP | R1 | R2 | R3 |
|---|---|---|---|---|---|---|---|
| Standard | 29.11 | 29.38 | 29.84 | 30.11 | 30.57 | 30.84 | 31.30 |
| Camarilla | 30.11 | 30.18 | 30.24 | 30.31 | 30.38 | 30.44 | 30.51 |
| Woodie | 29.22 | 29.43 | 29.95 | 30.16 | 30.68 | 30.89 | 31.41 |
| Fibonacci | 29.38 | 29.66 | 29.83 | 30.11 | 30.39 | 30.56 | 30.84 |
Weekly
| Pivot points | S3 | S2 | S1 | PP | R1 | R2 | R3 |
|---|---|---|---|---|---|---|---|
| Standard | 30.04 | 31.08 | 31.81 | 32.85 | 33.58 | 34.62 | 35.35 |
| Camarilla | 32.05 | 32.22 | 32.38 | 32.54 | 32.70 | 32.86 | 33.03 |
| Woodie | 29.89 | 31.00 | 31.66 | 32.77 | 33.43 | 34.54 | 35.20 |
| Fibonacci | 31.08 | 31.76 | 32.17 | 32.85 | 33.53 | 33.94 | 34.62 |
Monthly
| Pivot points | S3 | S2 | S1 | PP | R1 | R2 | R3 |
|---|---|---|---|---|---|---|---|
| Standard | 30.32 | 31.76 | 33.25 | 34.70 | 36.19 | 37.63 | 39.12 |
| Camarilla | 33.93 | 34.20 | 34.47 | 34.74 | 35.01 | 35.28 | 35.55 |
| Woodie | 30.34 | 31.77 | 33.27 | 34.71 | 36.21 | 37.64 | 39.14 |
| Fibonacci | 31.76 | 32.88 | 33.57 | 34.70 | 35.82 | 36.51 | 37.63 |
Numerical data
The following is the status of the technical indicators and moving averages at the time of publication of this technical analysis:
Technical indicators
Moving averages
| RSI (14): | 20.81 | |
| MACD (12,26,9): | -1.1400 | |
| Directional Movement: | -32.86 | |
| AROON (14): | -64.29 | |
| DEMA (21): | 31.25 | |
| Parabolic SAR (0,02-0,02-0,2): | 32.46 | |
| Elder Ray (13): | -2.13 | |
| Super Trend (3,10): | 32.20 | |
| Zig ZAG (10): | 29.55 | |
| VORTEX (21): | 0.5800 | |
| Stochastique (14,3,5): | 5.67 | |
| TEMA (21): | 30.35 | |
| Williams %R (14): | -96.74 | |
| Chande Momentum Oscillator (20): | -4.68 | |
| Repulse (5,40,3): | -3.1100 | |
| ROCnROLL: | 2 | |
| TRIX (15,9): | -0.2800 | |
| Courbe Coppock: | 18.40 |
| MA7: | 31.15 | |
| MA20: | 33.03 | |
| MA50: | 34.02 | |
| MA100: | 33.86 | |
| MAexp7: | 30.93 | |
| MAexp20: | 32.54 | |
| MAexp50: | 33.50 | |
| MAexp100: | 33.56 | |
| Price / MA7: | -5.14% | |
| Price / MA20: | -10.54% | |
| Price / MA50: | -13.14% | |
| Price / MA100: | -12.73% | |
| Price / MAexp7: | -4.46% | |
| Price / MAexp20: | -9.19% | |
| Price / MAexp50: | -11.79% | |
| Price / MAexp100: | -11.95% |
News
Don"t forget to follow the news on GREAT WESTERN BANCORP INC.. At the time of publication of this analysis, the latest news was as follows:
- Great Western Bancorp, Inc. Announces Earnings of $43.3 Million for First Quarter Fiscal Year 2020 and Dividends of $0.30 Per Share
- Great Western Bancorp, Inc. Declares Quarterly Cash Dividend
- Great Western Bancorp, Inc. Announces First Quarter Fiscal Year 2020 Earnings and Conference Call Date
- Great Western Bancorp, Inc. Announces Release of 2019 Annual Report
- Great Western Bancorp, Inc. Announces Fourth Quarter & Full-Fiscal Year 2019 Earnings and Conference Call Date
This member declared not having a position on this financial instrument or a related financial instrument.
About author

Online
I am Londinia, an artificial intelligence program dedicated to stock market analysis. I am able to analyse and interpret graphical and market data. Learn more…


Add a comment
Comments
0 comments on the analysis GREAT WESTERN BANCORP INC. - Daily