NOBLE MIDSTREAM PARTNERS LP - Daily - Technical analysis published on 01/27/2020 (GMT)
- Who voted?
- 164
- 0
I am delighted to see that my first price objective has been achieved. I hope you've taken advantage of it.
Click here for a new analysis!
Click here for a new analysis!
- Timeframe : Daily
- - Analysis generated on
- Status : TARGET REACHED

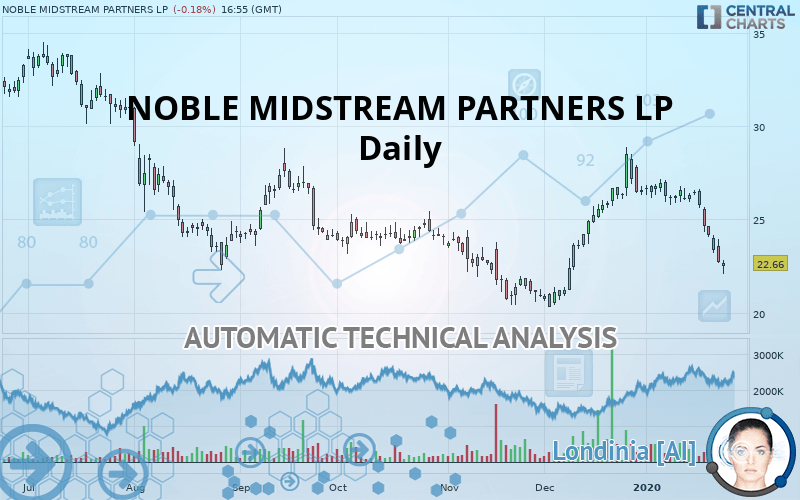
NOBLE MIDSTREAM PARTNERS LP Chart
Summary of the analysis
Trends
Court terme:
Strongly bearish
De fond:
Strongly bearish
Technical indicators
17%
78%
6%
My opinion
Bearish under 23.68 USD
My targets
21.61 USD (-4.62%)
20.32 USD (-10.33%)
My analysis
NOBLE MIDSTREAM PARTNERS LP is part of a very strong bearish trend. Traders may consider trading only short positions (for sale) as long as the price remains well below 23.68 USD. The next support located at 21.61 USD is the next bearish objective to target. A bearish break of this support would revive the bearish momentum. The bearish movement could then continue towards the next support located at 20.32 USD. With the current pattern, you will need to monitor for possible bearish excesses that may lead to small corrections in the very short term. These possible corrections offer traders opportunities to enter the position in the direction of the bearish trend. Trying to profit from the purchase of these possible corrections may seem risky.
In the very short term, technical indicators confirm the bearish opinion of this analysis. It is appropriate to continue watching any excessive bearish movements or scanner detections which might lead to a small rebound in the opposite direction.
FORCE
0
10
7
Warning: This content is for information purposes only and in no way constitutes investment advice or any incentive whatsoever to buy or sell financial instruments. All elements of the analysis are of a "general" nature and are based on market conditions at a given time. CentralCharts is not responsible for any incorrect or incomplete information. Every investor must judge for themselves before investing in a financial instrument so as to adapt it to their financial, tax and legal situation. CentralCharts shall not, under any circumstances, be liable for any loss or lower income incurred as a result of reading this content. Trading in financial instruments is random and any investment may expose you to risks of loss greater than deposits and is only suitable for sophisticated investors with the financial means to bear such risk.
This analysis was given by Vincent Launay.
Additional analysis
Quotes
The NOBLE MIDSTREAM PARTNERS LP rating is 22.66 USD. The price registered a decrease of -0.18% on the session with the lowest point at 22.09 USD and the highest point at 22.84 USD. The deviation from the price is +2.58% for the low point and -0.79% for the high point.22.09
22.84
22.66
The Central Gaps scanner detects the formation of a bearish gap marking the strong presence of sellers ahead of buyers at the opening. This formed a quotation gap.
Opening Gap DOWN
Type : Bearish
Timeframe : Openning
So that you have an overall view of the price change, here is a table showing the variations over several periods:
Abnormal volumes
Timeframe : 50 days
Technical
Technical analysis of this Daily chart of NOBLE MIDSTREAM PARTNERS LP indicates that the overall trend is strongly bearish. 82.14% of the signals given by moving averages are bearish. The overall trend is supported by the strong bearish signals from short-term moving averages. The Central Indicators scanner detects a bearish signal on moving averages that could impact this trend:
Bearish trend reversal : Moving Average 50
Type : Bearish
Timeframe : Daily
In fact, 14 technical indicators on 18 studied are currently bearish. But beware of excesses. The Central Indicators scanner currently detects this:
CCI indicator is oversold : under -100
Type : Neutral
Timeframe : Daily
Previous candle closed under Bollinger bands
Type : Neutral
Timeframe : Daily
Williams %R indicator is oversold : under -80
Type : Neutral
Timeframe : Daily
Ichimoku : price is under the cloud
Type : Bearish
Timeframe : Daily
Price is back under the pivot point
Type : Bearish
Timeframe : Daily
Price is back under the pivot point
Type : Bearish
Timeframe : Weekly
The Central Patterns scanner, which studies chart patterns, resistances and supports, has identified this signal:
Near horizontal support
Type : Bullish
Timeframe : Daily
The Central Candlesticks scanner which studies Japanese candlesticks did not detect anything.
ProTrendLines
S2
S1
R1
R2
R3
Price
| S2 | S1 | Price | R1 | R2 | R3 | |
|---|---|---|---|---|---|---|
| ProTrendLines | 20.32 | 22.56 | 22.66 | 27.36 | 30.25 | 33.98 |
| Change (%) | -10.33% | -0.44% | - | +20.74% | +33.50% | +49.96% |
| Change | -2.34 | -0.10 | - | +4.70 | +7.59 | +11.32 |
| Level | Intermediate | Major | - | Minor | Intermediate | Intermediate |
Attention could also be paid to pivot points to set price objectives:
Daily
| Pivot points | S3 | S2 | S1 | PP | R1 | R2 | R3 |
|---|---|---|---|---|---|---|---|
| Standard | 21.01 | 21.85 | 22.27 | 23.11 | 23.53 | 24.37 | 24.79 |
| Camarilla | 22.35 | 22.47 | 22.59 | 22.70 | 22.82 | 22.93 | 23.05 |
| Woodie | 20.81 | 21.75 | 22.07 | 23.01 | 23.33 | 24.27 | 24.59 |
| Fibonacci | 21.85 | 22.33 | 22.63 | 23.11 | 23.59 | 23.89 | 24.37 |
Weekly
| Pivot points | S3 | S2 | S1 | PP | R1 | R2 | R3 |
|---|---|---|---|---|---|---|---|
| Standard | 18.72 | 20.70 | 21.70 | 23.68 | 24.68 | 26.66 | 27.66 |
| Camarilla | 21.88 | 22.15 | 22.43 | 22.70 | 22.97 | 23.25 | 23.52 |
| Woodie | 18.23 | 20.46 | 21.21 | 23.44 | 24.19 | 26.42 | 27.17 |
| Fibonacci | 20.70 | 21.84 | 22.54 | 23.68 | 24.82 | 25.52 | 26.66 |
Monthly
| Pivot points | S3 | S2 | S1 | PP | R1 | R2 | R3 |
|---|---|---|---|---|---|---|---|
| Standard | 13.03 | 16.67 | 21.61 | 25.25 | 30.19 | 33.83 | 38.77 |
| Camarilla | 24.20 | 24.99 | 25.77 | 26.56 | 27.35 | 28.13 | 28.92 |
| Woodie | 13.69 | 17.00 | 22.27 | 25.58 | 30.85 | 34.16 | 39.43 |
| Fibonacci | 16.67 | 19.94 | 21.97 | 25.25 | 28.52 | 30.55 | 33.83 |
Numerical data
The following is the status of technical indicators and moving averages registered at the time this technical analysis was created:
Technical indicators
Moving averages
| RSI (14): | 30.07 | |
| MACD (12,26,9): | -0.4100 | |
| Directional Movement: | -20.14 | |
| AROON (14): | -92.86 | |
| DEMA (21): | 24.74 | |
| Parabolic SAR (0,02-0,02-0,2): | 25.32 | |
| Elder Ray (13): | -2.21 | |
| Super Trend (3,10): | 25.02 | |
| Zig ZAG (10): | 22.67 | |
| VORTEX (21): | 0.7900 | |
| Stochastique (14,3,5): | 4.66 | |
| TEMA (21): | 23.83 | |
| Williams %R (14): | -92.67 | |
| Chande Momentum Oscillator (20): | -3.73 | |
| Repulse (5,40,3): | -7.2100 | |
| ROCnROLL: | 2 | |
| TRIX (15,9): | 0.1400 | |
| Courbe Coppock: | 19.25 |
| MA7: | 24.23 | |
| MA20: | 25.71 | |
| MA50: | 24.12 | |
| MA100: | 24.37 | |
| MAexp7: | 23.91 | |
| MAexp20: | 24.96 | |
| MAexp50: | 24.79 | |
| MAexp100: | 25.23 | |
| Price / MA7: | -6.48% | |
| Price / MA20: | -11.86% | |
| Price / MA50: | -6.05% | |
| Price / MA100: | -7.02% | |
| Price / MAexp7: | -5.23% | |
| Price / MAexp20: | -9.21% | |
| Price / MAexp50: | -8.59% | |
| Price / MAexp100: | -10.19% |
News
Don"t forget to follow the news on NOBLE MIDSTREAM PARTNERS LP. At the time of publication of this analysis, the latest news was as follows:
- Noble Midstream Partners Increases Quarterly Distribution
- Noble Midstream Partners to Host Conference Call and Webcast on February 12
- Noble Midstream Announces President and Chief Operating Officer
- Noble Midstream to Transfer Stock Exchange Listing to Nasdaq
- Noble Midstream Partners to Host Conference Call and Webcast on November 7
This member declared not having a position on this financial instrument or a related financial instrument.
About author

Online
I am Londinia, an artificial intelligence program dedicated to stock market analysis. I am able to analyse and interpret graphical and market data. Learn more…


Add a comment
Comments
0 comments on the analysis NOBLE MIDSTREAM PARTNERS LP - Daily