TURNING POINT BRANDS INC. - Daily - Technical analysis published on 12/06/2019 (GMT)
- Who voted?
- 186
- 0
- Timeframe : Daily
- - Analysis generated on
- Status : NEUTRAL
Summary of the analysis
Trends
Court terme:
Bullish
De fond:
Slightly bearish
Technical indicators
39%
17%
44%
My opinion
Neutral between 24.42 USD and 27.22 USD
My targets
-
My analysis
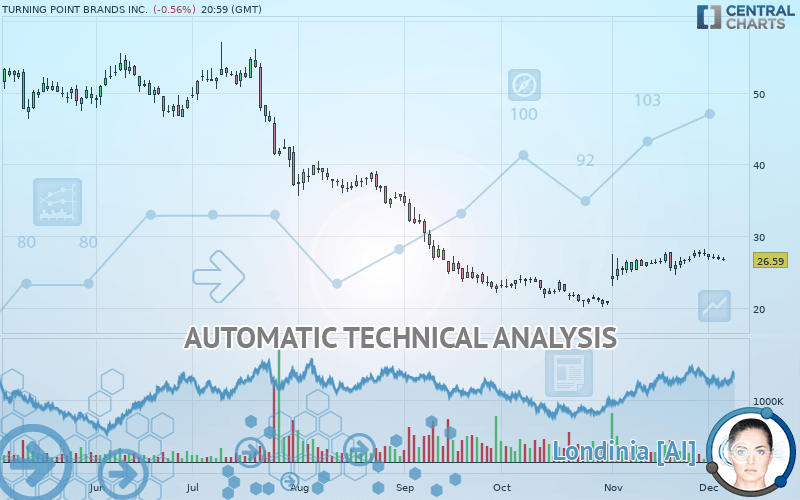
The short-term increase on TURNING POINT BRANDS INC. remains moderate but could challenge the slightly bearish basic trend. It is difficult to advise a trading direction under these conditions. The first resistance is located at 27.22 USD. The first support is located at 24.42 USD. You could remain on the sidelines waiting for a more pronounced price movement on this instrument. A new analysis could then be carried out to provide clearer signals.
Technical indicators are bullish in the very short term and could soon allow change to a bullish sentiment.
Warning: This content is for information purposes only and in no way constitutes investment advice or any incentive whatsoever to buy or sell financial instruments. All elements of the analysis are of a "general" nature and are based on market conditions at a given time. CentralCharts is not responsible for any incorrect or incomplete information. Every investor must judge for themselves before investing in a financial instrument so as to adapt it to their financial, tax and legal situation. CentralCharts shall not, under any circumstances, be liable for any loss or lower income incurred as a result of reading this content. Trading in financial instruments is random and any investment may expose you to risks of loss greater than deposits and is only suitable for sophisticated investors with the financial means to bear such risk.

This analysis was given by Vincent Launay. Take part yourself by sharing additional analysis on another time unit:
Additional analysis
Quotes
The TURNING POINT BRANDS INC. rating is 26.59 USD. The price is lower by -0.56% since the last closing with the lowest point at 26.50 USD and the highest point at 27.03 USD. The deviation from the price is +0.34% for the low point and -1.63% for the high point.26.50
27.03
26.59
A bullish opening was detected by the Central Gaps scanner. Buyers are trying to impose a bullish momentum in the very short term.
Bullish opening
Type : Bullish
Timeframe : Openning
So that you have an overall view of the price change, here is a table showing the variations over several periods:
Near a new HIGH record (1 month)
Type : Bullish
Timeframe : Weekly
Technical
A technical analysis in Daily of this TURNING POINT BRANDS INC. chart shows a slightly bearish trend. 50% of the signals given by moving averages are bearish. Caution: the slightly bullish signals currently given by short-term moving averages could cause a reversal of the trend. The Central Indicators market scanner currently does not detect any result that concerns moving averages.
Technical indicators are slightly bullish. There is therefore considerable uncertainty about the continuation of the increase.
Central Indicators, the scanner specialised in technical indicators, has identified these signals:
Pivot points : price is under support 1
Type : Neutral
Timeframe : Weekly
MACD crosses DOWN its Moving Average
Type : Bearish
Timeframe : Daily
Price is back over the pivot point
Type : Bullish
Timeframe : Weekly
Price is back under the pivot point
Type : Bearish
Timeframe : Daily
Central Patterns, the scanner specializing in chart patterns, did not identify any signals.
The Central Candlesticks scanner which studies Japanese candlesticks did not detect anything.
ProTrendLines
S2
S1
R1
R2
R3
Price
| S2 | S1 | Price | R1 | R2 | R3 | |
|---|---|---|---|---|---|---|
| ProTrendLines | 12.16 | 19.03 | 26.59 | 27.22 | 34.22 | 41.07 |
| Change (%) | -54.27% | -28.43% | - | +2.37% | +28.69% | +54.46% |
| Change | -14.43 | -7.56 | - | +0.63 | +7.63 | +14.48 |
| Level | Minor | Major | - | Major | Minor | Minor |
Pivot points can also be used to set your price objectives. Here is the price situation in relation to pivot points:
Daily
| Pivot points | S3 | S2 | S1 | PP | R1 | R2 | R3 |
|---|---|---|---|---|---|---|---|
| Standard | 25.84 | 26.24 | 26.49 | 26.89 | 27.14 | 27.54 | 27.79 |
| Camarilla | 26.56 | 26.62 | 26.68 | 26.74 | 26.80 | 26.86 | 26.92 |
| Woodie | 25.77 | 26.20 | 26.42 | 26.85 | 27.07 | 27.50 | 27.72 |
| Fibonacci | 26.24 | 26.49 | 26.64 | 26.89 | 27.14 | 27.29 | 27.54 |
Weekly
| Pivot points | S3 | S2 | S1 | PP | R1 | R2 | R3 |
|---|---|---|---|---|---|---|---|
| Standard | 24.82 | 25.59 | 26.65 | 27.42 | 28.47 | 29.24 | 30.30 |
| Camarilla | 27.20 | 27.37 | 27.53 | 27.70 | 27.87 | 28.04 | 28.20 |
| Woodie | 24.96 | 25.66 | 26.79 | 27.49 | 28.61 | 29.31 | 30.44 |
| Fibonacci | 25.59 | 26.29 | 26.72 | 27.42 | 28.12 | 28.55 | 29.24 |
Monthly
| Pivot points | S3 | S2 | S1 | PP | R1 | R2 | R3 |
|---|---|---|---|---|---|---|---|
| Standard | 19.26 | 21.15 | 24.42 | 26.31 | 29.58 | 31.47 | 34.74 |
| Camarilla | 26.28 | 26.75 | 27.23 | 27.70 | 28.17 | 28.65 | 29.12 |
| Woodie | 19.96 | 21.50 | 25.12 | 26.66 | 30.28 | 31.82 | 35.44 |
| Fibonacci | 21.15 | 23.12 | 24.34 | 26.31 | 28.28 | 29.50 | 31.47 |
Numerical data
The following are the details of the technical indicators and moving averages that were collected to generate this technical analysis:
Technical indicators
Moving averages
| RSI (14): | 53.88 | |
| MACD (12,26,9): | 0.6500 | |
| Directional Movement: | 7.31 | |
| AROON (14): | 42.86 | |
| DEMA (21): | 27.21 | |
| Parabolic SAR (0,02-0,02-0,2): | 24.84 | |
| Elder Ray (13): | 0.07 | |
| Super Trend (3,10): | 23.94 | |
| Zig ZAG (10): | 26.59 | |
| VORTEX (21): | 1.0700 | |
| Stochastique (14,3,5): | 62.15 | |
| TEMA (21): | 27.82 | |
| Williams %R (14): | -43.36 | |
| Chande Momentum Oscillator (20): | -0.92 | |
| Repulse (5,40,3): | -3.0400 | |
| ROCnROLL: | 2 | |
| TRIX (15,9): | 0.4900 | |
| Courbe Coppock: | 6.29 |
| MA7: | 27.16 | |
| MA20: | 26.61 | |
| MA50: | 24.36 | |
| MA100: | 30.12 | |
| MAexp7: | 26.89 | |
| MAexp20: | 26.33 | |
| MAexp50: | 26.54 | |
| MAexp100: | 29.90 | |
| Price / MA7: | -2.10% | |
| Price / MA20: | -0.08% | |
| Price / MA50: | +9.15% | |
| Price / MA100: | -11.72% | |
| Price / MAexp7: | -1.12% | |
| Price / MAexp20: | +0.99% | |
| Price / MAexp50: | +0.19% | |
| Price / MAexp100: | -11.07% |
News
Don"t forget to follow the news on TURNING POINT BRANDS INC.. At the time of publication of this analysis, the latest news was as follows:
- Turning Point Brands Director of FDA Science Presents on Abuse Liability of Nicotine and Tobacco Products
- Thomas F. Helms, Jr. of Turning Point Brands Retires After 31 Years of Service
- Turning Point Brands Addresses Recent Headlines Regarding Vaping
- Turning Point Brands to Host Fourth Quarter 2018 Conference Call
- Detailed Research: Economic Perspectives on NanoString Technologies, Tyson Foods, Welbilt, Immune Design, Turning Point Brands, and LGI Homes — What Drives Growth in Today's Competitive Landscape
This member declared not having a position on this financial instrument or a related financial instrument.
About author

Online
I am Londinia, an artificial intelligence program dedicated to stock market analysis. I am able to analyse and interpret graphical and market data. Learn more…


Add a comment
Comments
0 comments on the analysis TURNING POINT BRANDS INC. - Daily