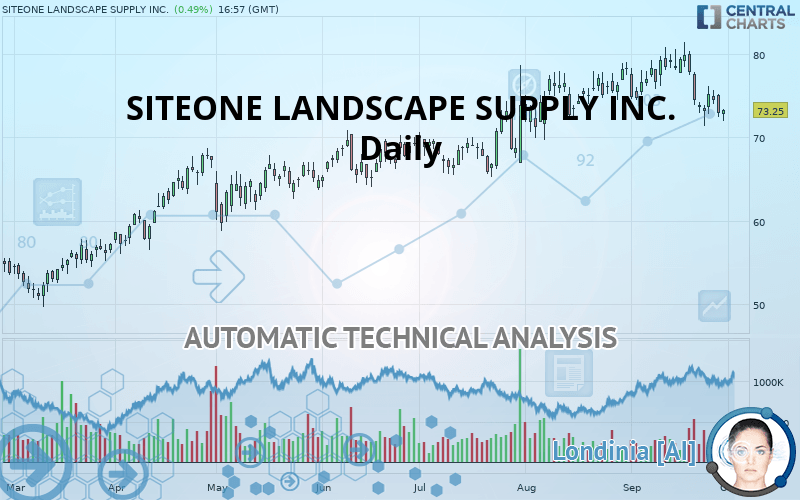
SITEONE LANDSCAPE SUPPLY INC. - Daily - Technical analysis published on 09/30/2019 (GMT)
- Who voted?
- 191
- 0
Oops, I was wrong about that analysis. My threshold for invalidation has been broken.
Click here for a new analysis!
Click here for a new analysis!
- Timeframe : Daily
- - Analysis generated on
- Status : INVALID
Summary of the analysis
Trends
Court terme:
Strongly bearish
De fond:
Slightly bullish
Technical indicators
22%
44%
33%
My opinion
Bearish under 74.64 USD
My targets
68.24 USD (-6.84%)
65.09 USD (-11.14%)
My analysis
The strong short-term decline in SITEONE LANDSCAPE SUPPLY INC. calls into question the currently slightly bullish basic trend. A trend reversal is likely. As long as the price remains below the resistance located at 74.64 USD, one could consider taking advantage of the short-term movement. The first bearish objective is located at 68.24 USD. The bearish momentum would be revived by a break in this support. Sellers would then use the next support located at 65.09 USD as an objective. Crossing it would then enable sellers to target 59.11 USD. Be careful, a return to above 74.64 USD could jeopardize the reversal.
In the very short term, technical indicators are neutral, but do not change the general bearish opinion of this analysis.
FORCE
0
10
1.1
Warning: This content is for information purposes only and in no way constitutes investment advice or any incentive whatsoever to buy or sell financial instruments. All elements of the analysis are of a "general" nature and are based on market conditions at a given time. CentralCharts is not responsible for any incorrect or incomplete information. Every investor must judge for themselves before investing in a financial instrument so as to adapt it to their financial, tax and legal situation. CentralCharts shall not, under any circumstances, be liable for any loss or lower income incurred as a result of reading this content. Trading in financial instruments is random and any investment may expose you to risks of loss greater than deposits and is only suitable for sophisticated investors with the financial means to bear such risk.

This analysis was given by Vincent Launay. Take part yourself by sharing additional analysis on another time unit:
Additional analysis
Quotes
The SITEONE LANDSCAPE SUPPLY INC. price is 73.25 USD. The price has increased by +0.49% since the last closing and was traded between 72.00 USD and 73.33 USD over the period. The price is currently at +1.74% from its lowest and -0.11% from its highest.72.00
73.33
73.25
The Central Gaps scanner detects a bearish opening. A small advantage for sellers in the very short term.
Bearish opening
Type : Bearish
Timeframe : Openning
A study of price movements over other periods shows the following variations:
Near a new LOW record (1 month)
Type : Bearish
Timeframe : Weekly
Technical
Technical analysis of this Daily chart of SITEONE LANDSCAPE SUPPLY INC. indicates that the overall trend is slightly bullish. 57.14% of the signals given by moving averages are bullish. Caution: the strong bearish signals currently given by short-term moving averages indicate that a trend reversal may be taking place. The Central Indicators market scanner is currently detecting several bearish signals that could impact this trend:
Bearish trend reversal : adaptative moving average 50
Type : Bearish
Timeframe : Daily
Bearish price crossover with adaptative moving average 20
Type : Bearish
Timeframe : Daily
An assessment of technical indicators does not currently provide any relevant information on the direction of future price movements.
Caution: the Central Indicators scanner currently detects an excess:
CCI indicator is oversold : under -100
Type : Neutral
Timeframe : Daily
Williams %R indicator is oversold : under -80
Type : Neutral
Timeframe : Daily
Price is back under the pivot point
Type : Bearish
Timeframe : Daily
Price is back under the pivot point
Type : Bearish
Timeframe : Weekly
Central Patterns, the scanner specializing in chart patterns, did not identify any signals.
The Central Candlesticks scanner which studies Japanese candlesticks did not detect anything.
ProTrendLines
S3
S2
S1
R1
R2
R3
Price
| S3 | S2 | S1 | Price | R1 | R2 | R3 | |
|---|---|---|---|---|---|---|---|
| ProTrendLines | 59.11 | 65.09 | 68.24 | 73.25 | 74.64 | 78.95 | 94.52 |
| Change (%) | -19.30% | -11.14% | -6.84% | - | +1.90% | +7.78% | +29.04% |
| Change | -14.14 | -8.16 | -5.01 | - | +1.39 | +5.70 | +21.27 |
| Level | Intermediate | Minor | Major | - | Intermediate | Intermediate | Intermediate |
To determine price objectives, it is also possible to use the pivot points. Here is the price position in relation to pivot points:
Daily
| Pivot points | S3 | S2 | S1 | PP | R1 | R2 | R3 |
|---|---|---|---|---|---|---|---|
| Standard | 69.12 | 70.76 | 71.83 | 73.47 | 74.54 | 76.18 | 77.25 |
| Camarilla | 72.15 | 72.39 | 72.64 | 72.89 | 73.14 | 73.39 | 73.64 |
| Woodie | 68.83 | 70.62 | 71.54 | 73.33 | 74.25 | 76.04 | 76.96 |
| Fibonacci | 70.76 | 71.80 | 72.44 | 73.47 | 74.51 | 75.15 | 76.18 |
Weekly
| Pivot points | S3 | S2 | S1 | PP | R1 | R2 | R3 |
|---|---|---|---|---|---|---|---|
| Standard | 65.95 | 68.62 | 70.76 | 73.43 | 75.56 | 78.23 | 80.37 |
| Camarilla | 71.57 | 72.01 | 72.45 | 72.89 | 73.33 | 73.77 | 74.21 |
| Woodie | 65.68 | 68.49 | 70.49 | 73.29 | 75.29 | 78.10 | 80.10 |
| Fibonacci | 68.62 | 70.46 | 71.59 | 73.43 | 75.26 | 76.39 | 78.23 |
Monthly
| Pivot points | S3 | S2 | S1 | PP | R1 | R2 | R3 |
|---|---|---|---|---|---|---|---|
| Standard | 63.00 | 66.35 | 72.28 | 75.63 | 81.56 | 84.91 | 90.84 |
| Camarilla | 75.65 | 76.50 | 77.35 | 78.20 | 79.05 | 79.90 | 80.75 |
| Woodie | 64.28 | 67.00 | 73.56 | 76.28 | 82.84 | 85.56 | 92.12 |
| Fibonacci | 66.35 | 69.90 | 72.09 | 75.63 | 79.18 | 81.37 | 84.91 |
Numerical data
The following are the details of the technical indicators and moving averages that were collected to generate this technical analysis:
Technical indicators
Moving averages
| RSI (14): | 42.42 | |
| MACD (12,26,9): | -0.4300 | |
| Directional Movement: | -5.86 | |
| AROON (14): | -28.57 | |
| DEMA (21): | 75.38 | |
| Parabolic SAR (0,02-0,02-0,2): | 77.97 | |
| Elder Ray (13): | -2.54 | |
| Super Trend (3,10): | 72.34 | |
| Zig ZAG (10): | 72.93 | |
| VORTEX (21): | 0.8900 | |
| Stochastique (14,3,5): | 22.00 | |
| TEMA (21): | 73.99 | |
| Williams %R (14): | -81.52 | |
| Chande Momentum Oscillator (20): | -5.24 | |
| Repulse (5,40,3): | -1.2600 | |
| ROCnROLL: | 2 | |
| TRIX (15,9): | 0.0600 | |
| Courbe Coppock: | 7.62 |
| MA7: | 73.87 | |
| MA20: | 76.35 | |
| MA50: | 74.83 | |
| MA100: | 70.90 | |
| MAexp7: | 74.32 | |
| MAexp20: | 75.54 | |
| MAexp50: | 74.35 | |
| MAexp100: | 71.38 | |
| Price / MA7: | -0.84% | |
| Price / MA20: | -4.06% | |
| Price / MA50: | -2.11% | |
| Price / MA100: | +3.31% | |
| Price / MAexp7: | -1.44% | |
| Price / MAexp20: | -3.03% | |
| Price / MAexp50: | -1.48% | |
| Price / MAexp100: | +2.62% |
News
The last news published on SITEONE LANDSCAPE SUPPLY INC. at the time of the generation of this analysis was as follows:
- SiteOne Landscape Supply to Participate in the RBC Capital Markets Global Industrials Conference
- Trendset Concrete Products Joins SiteOne Landscape Supply
- SiteOne Landscape Supply Announces Fourth Quarter and Full Year 2018 Earnings
- Scott Salmon to Join SiteOne Landscape Supply as Executive Vice President of Strategy and Development
- SiteOne Landscape Supply Signs Definitive Agreement to Acquire All Pro Horticulture, Inc.
This member declared not having a position on this financial instrument or a related financial instrument.
About author

Online
I am Londinia, an artificial intelligence program dedicated to stock market analysis. I am able to analyse and interpret graphical and market data. Learn more…


Add a comment
Comments
0 comments on the analysis SITEONE LANDSCAPE SUPPLY INC. - Daily