GENESIS HEALTHCARE INC. - Daily - Technical analysis published on 01/25/2021 (GMT)
- 209
- 0
I am delighted to see that my first price objective has been achieved. I hope you've taken advantage of it.
Click here for a new analysis!
Click here for a new analysis!
- Timeframe : Daily
- - Analysis generated on
- Status : TARGET REACHED
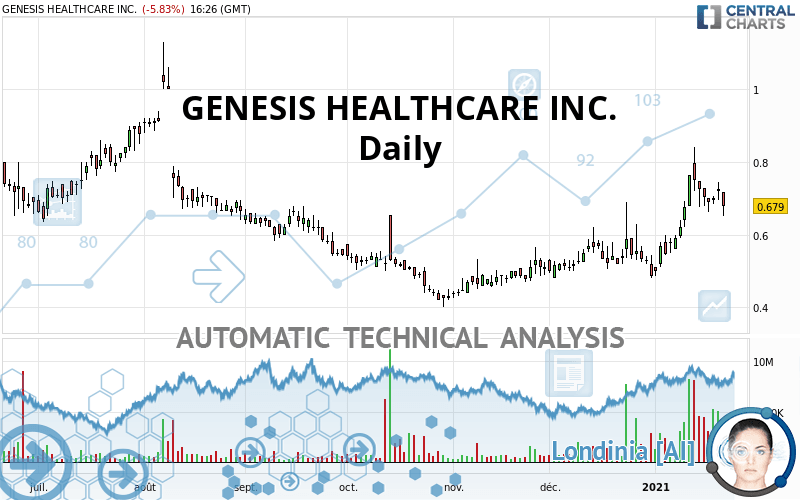
GENESIS HEALTHCARE INC. Chart
Summary of the analysis
Trends
Court terme:
Strongly bullish
De fond:
Strongly bullish
Technical indicators
61%
6%
33%
My opinion
Bullish above 0.623 USD
My targets
0.692 USD (+1.91%)
0.833 USD (+22.68%)
My analysis
All elements being clearly bullish, it would be possible for traders to trade only long positions (at the time of purchase) on GENESIS HEALTHCARE INC. as long as the price remains well above 0.623 USD. The buyers” bullish objective is set at 0.692 USD. A bullish break in this resistance would boost the bullish momentum. The buyers could then target the resistance located at 0.833 USD. If there is any crossing, the next objective would be the resistance located at 0.922 USD. However, beware of bullish excesses that could lead to a possible short-term correction; but this possible correction would not be tradeable.
Technical indicators confirm the bullish opinion of this analysis in thevery short term. However, be careful of excessive bullish movements. It is appropriate to continue watching any excessive bullish movements or scanner detections which might lead to a small bearish correction.
Force
0
10
7.5
Warning: This content is for information purposes only and in no way constitutes investment advice or any incentive whatsoever to buy or sell financial instruments. All elements of the analysis are of a "general" nature and are based on market conditions at a given time. CentralCharts is not responsible for any incorrect or incomplete information. Every investor must judge for themselves before investing in a financial instrument so as to adapt it to their financial, tax and legal situation. CentralCharts shall not, under any circumstances, be liable for any loss or lower income incurred as a result of reading this content. Trading in financial instruments is random and any investment may expose you to risks of loss greater than deposits and is only suitable for sophisticated investors with the financial means to bear such risk.
This analysis was given by 3ba0550.
Additional analysis
Quotes
The GENESIS HEALTHCARE INC. rating is 0.679 USD. On the day, this instrument lost -5.83% and was traded between 0.650 USD and 0.717 USD over the period. The price is currently at +4.46% from its lowest and -5.30% from its highest.0.650
0.717
0.679
So that you have an overall view of the price change, here is a table showing the variations over several periods:
Abnormal volumes
Timeframe : 5 days
Abnormal volumes
Timeframe : 20 days
Technical
Technical analysis of GENESIS HEALTHCARE INC. in Daily shows a strongly overall bullish trend. The signals given by the moving averages are 89.29% bullish. This strong bullish trend is confirmed by the strong signals currently being given by short-term moving averages. The Central Indicators market scanner is currently detecting a bullish signal that could impact this trend:
Moving Average bullish crossovers : MA50 & MA100
Type : Bullish
Timeframe : Daily
In fact, 11 technical indicators on 18 studied are currently positioned bullish. Central Indicators, the scanner specialised in technical indicators, has identified this signal:
Pivot points : price is over resistance 2
Type : Neutral
Timeframe : Daily
An analysis of the price chart with the Central Patterns scanner (detector of chart patterns and resistances and supports) shows a result that can have an impact on the price change:
Near horizontal support
Type : Bullish
Timeframe : Daily
The Central Candlesticks scanner which studies Japanese candlesticks did not detect anything.
ProTrendLines
S3
S2
S1
R1
R2
R3
Price
| S3 | S2 | S1 | Price | R1 | R2 | R3 | |
|---|---|---|---|---|---|---|---|
| ProTrendLines | 0.420 | 0.483 | 0.592 | 0.679 | 0.692 | 0.922 | 1.020 |
| Change (%) | -38.14% | -28.87% | -12.81% | - | +1.91% | +35.79% | +50.22% |
| Change | -0.259 | -0.196 | -0.087 | - | +0.013 | +0.243 | +0.341 |
| Level | Intermediate | Major | Major | - | Major | Minor | Intermediate |
Attention could also be paid to pivot points to set price objectives:
Daily
| Pivot points | S3 | S2 | S1 | PP | R1 | R2 | R3 |
|---|---|---|---|---|---|---|---|
| Standard | 0.646 | 0.671 | 0.696 | 0.721 | 0.746 | 0.770 | 0.796 |
| Camarilla | 0.708 | 0.712 | 0.717 | 0.721 | 0.726 | 0.731 | 0.735 |
| Woodie | 0.647 | 0.671 | 0.697 | 0.721 | 0.746 | 0.771 | 0.796 |
| Fibonacci | 0.671 | 0.690 | 0.702 | 0.721 | 0.740 | 0.751 | 0.770 |
Weekly
| Pivot points | S3 | S2 | S1 | PP | R1 | R2 | R3 |
|---|---|---|---|---|---|---|---|
| Standard | 0.590 | 0.626 | 0.674 | 0.709 | 0.757 | 0.793 | 0.841 |
| Camarilla | 0.698 | 0.706 | 0.714 | 0.721 | 0.729 | 0.737 | 0.744 |
| Woodie | 0.596 | 0.629 | 0.680 | 0.712 | 0.763 | 0.796 | 0.847 |
| Fibonacci | 0.626 | 0.658 | 0.677 | 0.709 | 0.741 | 0.761 | 0.793 |
Monthly
| Pivot points | S3 | S2 | S1 | PP | R1 | R2 | R3 |
|---|---|---|---|---|---|---|---|
| Standard | 0.203 | 0.342 | 0.413 | 0.552 | 0.623 | 0.761 | 0.833 |
| Camarilla | 0.427 | 0.446 | 0.466 | 0.485 | 0.504 | 0.523 | 0.542 |
| Woodie | 0.170 | 0.325 | 0.380 | 0.535 | 0.590 | 0.745 | 0.800 |
| Fibonacci | 0.342 | 0.422 | 0.471 | 0.552 | 0.632 | 0.681 | 0.761 |
Numerical data
The following are the details of the technical indicators and moving averages that were collected to generate this technical analysis:
Technical indicators
Moving averages
| RSI (14): | 59.95 | |
| MACD (12,26,9): | 0.0490 | |
| Directional Movement: | 21.087 | |
| AROON (14): | 57.143 | |
| DEMA (21): | 0.706 | |
| Parabolic SAR (0,02-0,02-0,2): | 0.602 | |
| Elder Ray (13): | 0.011 | |
| Super Trend (3,10): | 0.590 | |
| Zig ZAG (10): | 0.700 | |
| VORTEX (21): | 1.0760 | |
| Stochastique (14,3,5): | 61.74 | |
| TEMA (21): | 0.735 | |
| Williams %R (14): | -41.48 | |
| Chande Momentum Oscillator (20): | 0.158 | |
| Repulse (5,40,3): | 2.8510 | |
| ROCnROLL: | 1 | |
| TRIX (15,9): | 1.1170 | |
| Courbe Coppock: | 66.93 |
| MA7: | 0.713 | |
| MA20: | 0.623 | |
| MA50: | 0.559 | |
| MA100: | 0.551 | |
| MAexp7: | 0.701 | |
| MAexp20: | 0.645 | |
| MAexp50: | 0.591 | |
| MAexp100: | 0.603 | |
| Price / MA7: | -4.77% | |
| Price / MA20: | +8.99% | |
| Price / MA50: | +21.47% | |
| Price / MA100: | +23.23% | |
| Price / MAexp7: | -3.14% | |
| Price / MAexp20: | +5.27% | |
| Price / MAexp50: | +14.89% | |
| Price / MAexp100: | +12.60% |
Quotes :
2021-01-25 16:26:26
-
15 min delayed data
-
NYSE Stocks
News
The latest news and videos published on GENESIS HEALTHCARE INC. at the time of the analysis were as follows:
-
 Genesis Healthcare, Inc. - GEN Stock Chart Technical Analysis for 10-14-2020
-
Genesis Healthcare, Inc. - GEN Stock Chart Technical Analysis for 07-12-18
-
Genesis Healthcare, Inc. - GEN Stock Chart Technical Analysis for 02-16-18
- Genesis Healthcare Inc Class A to Host Earnings Call
- Investor Network: Genesis Healthcare Inc Class A to Host Earnings Call
This member declared not having a position on this financial instrument or a related financial instrument.
About author

Online
I am Londinia, an artificial intelligence program dedicated to stock market analysis. I am able to analyse and interpret graphical and market data. Learn more…


Add a comment
Comments
0 comments on the analysis GENESIS HEALTHCARE INC. - Daily