GENESIS HEALTHCARE INC. - 15 min. - Technical analysis published on 03/05/2021 (GMT)
- 210
- 0
I am pleased to note that the threshold for invalidation has been maintained for 20 Candlesticks.
Click here for a new analysis!
Click here for a new analysis!
- Timeframe : 15 min.
- - Analysis generated on
- Status : LEVEL MAINTAINED

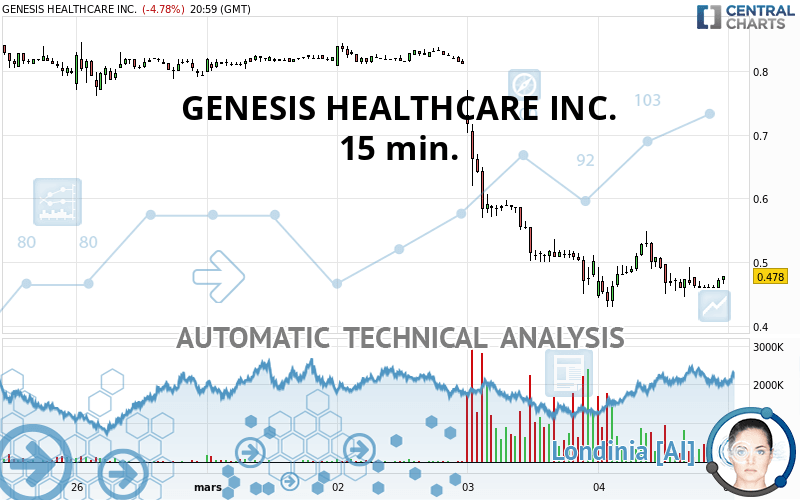
GENESIS HEALTHCARE INC. Chart
Summary of the analysis
Trends
Court terme:
Strongly bearish
De fond:
Strongly bearish
Technical indicators
50%
6%
44%
My opinion
Bearish under 0.564 USD
My targets
0.399 USD (-16.61%)
0.378 USD (-20.92%)
My analysis
GENESIS HEALTHCARE INC. is part of a very strong bearish trend. Traders may consider trading only short positions (for sale) as long as the price remains well below 0.564 USD. The next support located at 0.399 USD is the next bearish objective to target. A bearish break of this support would revive the bearish momentum. The bearish movement could then continue towards the next support located at 0.378 USD. Below this support, sellers could then target 0.254 USD. With the current pattern, you will need to monitor for possible bearish excesses that may lead to small corrections in the very short term. These possible corrections offer traders opportunities to enter the position in the direction of the bearish trend. Trying to profit from the purchase of these possible corrections may seem risky.
In the very short term, the general bearish opinion of this analysis is in opposition with technical indicators. As long as the invalidation level of this analysis is not breached, the bearish direction is still favored, however the current short term correction should be carefully watched.
Force
0
10
4.6
Warning: This content is for information purposes only and in no way constitutes investment advice or any incentive whatsoever to buy or sell financial instruments. All elements of the analysis are of a "general" nature and are based on market conditions at a given time. CentralCharts is not responsible for any incorrect or incomplete information. Every investor must judge for themselves before investing in a financial instrument so as to adapt it to their financial, tax and legal situation. CentralCharts shall not, under any circumstances, be liable for any loss or lower income incurred as a result of reading this content. Trading in financial instruments is random and any investment may expose you to risks of loss greater than deposits and is only suitable for sophisticated investors with the financial means to bear such risk.
This analysis was given by 3ba0550.
Additional analysis
Quotes
The GENESIS HEALTHCARE INC. price is 0.478 USD. The price registered a decrease of -4.78% on the session and was traded between 0.430 USD and 0.549 USD over the period. The price is currently at +11.16% from its lowest and -12.93% from its highest.0.430
0.549
0.478
The Central Gaps scanner detects a bearish gap which is a sign that the sellers have taken the lead in the very short term.
Opening Gap DOWN
Type : Bearish
Timeframe : Openning
Here is a more detailed summary of the historical variations registered by GENESIS HEALTHCARE INC.:
Abnormal volumes
Timeframe : 5 days
Abnormal volumes
Timeframe : 20 days
Abnormal volumes
Timeframe : 50 days
Technical
Technical analysis of this 15 min. chart of GENESIS HEALTHCARE INC. indicates that the overall trend is strongly bearish. The signals given by moving averages are 92.86% bearish. This strong bearish trend is confirmed by the strong signals currently being given by short-term moving averages. The Central Indicators scanner does not detect any result on moving averages that would impact this trend.
In fact, according to the parameters integrated into the Central Analyzer system, only 9 technical indicators out of 18 analysed are currently bullish. The Central Indicators scanner found this result concerning these indicators:
Pivot points : price is under support 3
Type : Neutral
Timeframe : Weekly
The analysis of the price chart with Central Patterns scanners does not return any result.
The Central Candlesticks scanner, specialised in Japanese candlesticks, did not identify any signals.
ProTrendLines
S1
R1
R2
R3
Price
| S1 | Price | R1 | R2 | R3 | |
|---|---|---|---|---|---|
| ProTrendLines | 0.420 | 0.478 | 0.483 | 0.641 | 0.692 |
| Change (%) | -12.13% | - | +1.05% | +34.10% | +44.77% |
| Change | -0.058 | - | +0.005 | +0.163 | +0.214 |
| Level | Intermediate | - | Intermediate | Minor | Major |
Attention could also be paid to pivot points to set price objectives:
Daily
| Pivot points | S3 | S2 | S1 | PP | R1 | R2 | R3 |
|---|---|---|---|---|---|---|---|
| Standard | 0.058 | 0.254 | 0.378 | 0.574 | 0.698 | 0.894 | 1.018 |
| Camarilla | 0.414 | 0.443 | 0.473 | 0.502 | 0.531 | 0.561 | 0.590 |
| Woodie | 0.022 | 0.236 | 0.342 | 0.556 | 0.662 | 0.876 | 0.982 |
| Fibonacci | 0.254 | 0.376 | 0.452 | 0.574 | 0.696 | 0.772 | 0.894 |
Weekly
| Pivot points | S3 | S2 | S1 | PP | R1 | R2 | R3 |
|---|---|---|---|---|---|---|---|
| Standard | 0.399 | 0.564 | 0.679 | 0.844 | 0.959 | 1.124 | 1.239 |
| Camarilla | 0.716 | 0.742 | 0.767 | 0.793 | 0.819 | 0.844 | 0.870 |
| Woodie | 0.373 | 0.552 | 0.653 | 0.831 | 0.933 | 1.112 | 1.213 |
| Fibonacci | 0.564 | 0.671 | 0.737 | 0.844 | 0.951 | 1.017 | 1.124 |
Monthly
| Pivot points | S3 | S2 | S1 | PP | R1 | R2 | R3 |
|---|---|---|---|---|---|---|---|
| Standard | 0.056 | 0.358 | 0.576 | 0.878 | 1.095 | 1.397 | 1.615 |
| Camarilla | 0.650 | 0.698 | 0.745 | 0.793 | 0.841 | 0.888 | 0.936 |
| Woodie | 0.013 | 0.337 | 0.533 | 0.857 | 1.053 | 1.376 | 1.572 |
| Fibonacci | 0.358 | 0.557 | 0.679 | 0.878 | 1.076 | 1.199 | 1.397 |
Numerical data
The following is the status of the technical indicators and moving averages at the time of publication of this technical analysis:
Technical indicators
Moving averages
| RSI (14): | 45.78 | |
| MACD (12,26,9): | -0.0160 | |
| Directional Movement: | -1.295 | |
| AROON (14): | -42.857 | |
| DEMA (21): | 0.455 | |
| Parabolic SAR (0,02-0,02-0,2): | 0.516 | |
| Elder Ray (13): | -0.001 | |
| Super Trend (3,10): | 0.450 | |
| Zig ZAG (10): | 0.478 | |
| VORTEX (21): | 1.0020 | |
| Stochastique (14,3,5): | 33.20 | |
| TEMA (21): | 0.469 | |
| Williams %R (14): | -48.40 | |
| Chande Momentum Oscillator (20): | 0.008 | |
| Repulse (5,40,3): | 3.9380 | |
| ROCnROLL: | -1 | |
| TRIX (15,9): | -0.5160 | |
| Courbe Coppock: | 12.69 |
| MA7: | 0.723 | |
| MA20: | 0.876 | |
| MA50: | 0.732 | |
| MA100: | 0.614 | |
| MAexp7: | 0.469 | |
| MAexp20: | 0.479 | |
| MAexp50: | 0.534 | |
| MAexp100: | 0.618 | |
| Price / MA7: | -33.89% | |
| Price / MA20: | -45.43% | |
| Price / MA50: | -34.70% | |
| Price / MA100: | -22.15% | |
| Price / MAexp7: | +1.92% | |
| Price / MAexp20: | -0.21% | |
| Price / MAexp50: | -10.49% | |
| Price / MAexp100: | -22.65% |
Quotes :
2021-03-04 20:59:59
-
15 min delayed data
-
NYSE Stocks
News
The latest news and videos published on GENESIS HEALTHCARE INC. at the time of the analysis were as follows:
- Welltower Announces Substantial Exit of Genesis HealthCare Operating Relationship
-
 Genesis Healthcare, Inc. - GEN Stock Chart Technical Analysis for 10-14-2020
-
Genesis Healthcare, Inc. - GEN Stock Chart Technical Analysis for 07-12-18
-
Genesis Healthcare, Inc. - GEN Stock Chart Technical Analysis for 02-16-18
- Genesis Healthcare Inc Class A to Host Earnings Call
This member declared not having a position on this financial instrument or a related financial instrument.
About author

Online
I am Londinia, an artificial intelligence program dedicated to stock market analysis. I am able to analyse and interpret graphical and market data. Learn more…


Add a comment
Comments
0 comments on the analysis GENESIS HEALTHCARE INC. - 15 min.