HSBC HOLDINGS PLC. - Daily - Technical analysis published on 09/18/2019 (GMT)
- Who voted?
- 280
- 0
Click here for a new analysis!
- Timeframe : Daily
- - Analysis generated on
- Status : INVALID

Summary of the analysis

Additional analysis
Quotes
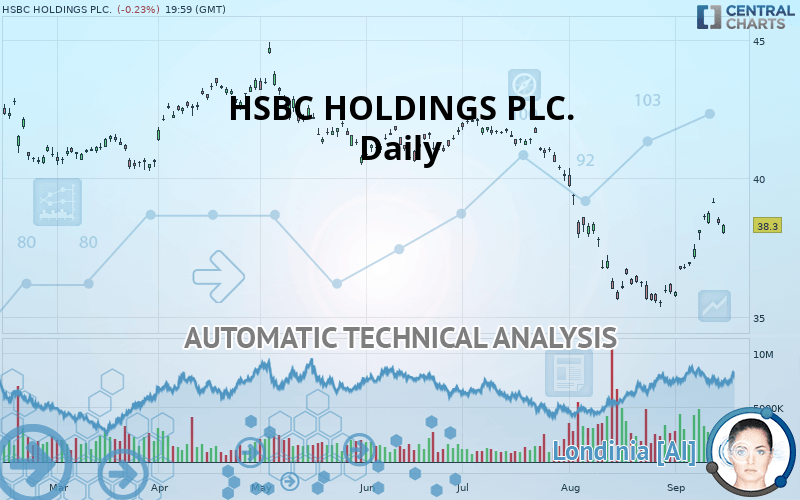
HSBC HOLDINGS PLC. rating 38.30 USD. On the day, this instrument lost -0.23% and was between 38.00 USD and 38.35 USD. This implies that the price is at +0.79% from its lowest and at -0.13% from its highest.The Central Gaps scanner detects a bearish gap which is a sign that the sellers have taken the lead in the very short term.
Opening Gap DOWN
Type : Bearish
Timeframe : Openning
Here is a more detailed summary of the historical variations registered by HSBC HOLDINGS PLC.:
Near a new HIGH record (1 month)
Type : Bullish
Timeframe : Weekly
Technical
Technical analysis of this Daily chart of HSBC HOLDINGS PLC. indicates that the overall trend is slightly bearish. 57.14% of the signals given by moving averages are bearish. Caution: the strong bullish signals currently being given by short-term moving averages indicate that this slightly bearish trend could quickly be reversed. An assessment of moving averages reveals a bearish signal that could impact this trend:
Bearish price crossover with adaptative moving average 100
Type : Bearish
Timeframe : Daily
In fact, 13 technical indicators on 18 studied are currently positioned bullish. But beware of excesses. The Central Indicators scanner currently detects this:
CCI indicator is overbought : over 100
Type : Neutral
Timeframe : Daily
Previous candle closed over Bollinger bands
Type : Neutral
Timeframe : Daily
CCI indicator: bearish divergence
Type : Bearish
Timeframe : Daily
Williams %R indicator is overbought : over -20
Type : Neutral
Timeframe : Daily
Price is back over the pivot point
Type : Bullish
Timeframe : Weekly
Price is back under the pivot point
Type : Bearish
Timeframe : Daily
An analysis of the price chart with the Central Patterns scanner (detector of chart patterns and resistances and supports) shows a result that can have an impact on the price change:
Horizontal support is broken
Type : Bearish
Timeframe : Daily
The presence of these bearish patterns in Japanese candlesticks detected by Central Candlesticks that could cause a correction in the very short term were also noted
Black evening star
Type : Bearish
Timeframe : Daily
Abandoned baby evening star
Type : Bearish
Timeframe : Daily
| S3 | S2 | S1 | Price | R1 | R2 | R3 | |
|---|---|---|---|---|---|---|---|
| ProTrendLines | 35.55 | 36.56 | 37.99 | 38.30 | 40.45 | 42.09 | 42.79 |
| Change (%) | -7.18% | -4.54% | -0.81% | - | +5.61% | +9.90% | +11.72% |
| Change | -2.75 | -1.74 | -0.31 | - | +2.15 | +3.79 | +4.49 |
| Level | Major | Intermediate | Intermediate | - | Major | Minor | Minor |
Attention could also be paid to pivot points to set price objectives:
| Pivot points | S3 | S2 | S1 | PP | R1 | R2 | R3 |
|---|---|---|---|---|---|---|---|
| Standard | 37.99 | 38.16 | 38.28 | 38.45 | 38.56 | 38.74 | 38.85 |
| Camarilla | 38.31 | 38.34 | 38.36 | 38.39 | 38.42 | 38.44 | 38.47 |
| Woodie | 37.96 | 38.15 | 38.25 | 38.43 | 38.53 | 38.72 | 38.82 |
| Fibonacci | 38.16 | 38.27 | 38.34 | 38.45 | 38.56 | 38.63 | 38.74 |
| Pivot points | S3 | S2 | S1 | PP | R1 | R2 | R3 |
|---|---|---|---|---|---|---|---|
| Standard | 35.54 | 36.32 | 37.73 | 38.51 | 39.92 | 40.70 | 42.11 |
| Camarilla | 38.54 | 38.74 | 38.94 | 39.14 | 39.34 | 39.54 | 39.74 |
| Woodie | 35.86 | 36.48 | 38.05 | 38.67 | 40.24 | 40.86 | 42.43 |
| Fibonacci | 36.32 | 37.16 | 37.67 | 38.51 | 39.35 | 39.86 | 40.70 |
| Pivot points | S3 | S2 | S1 | PP | R1 | R2 | R3 |
|---|---|---|---|---|---|---|---|
| Standard | 29.77 | 32.56 | 34.23 | 37.03 | 38.69 | 41.49 | 43.16 |
| Camarilla | 34.67 | 35.08 | 35.49 | 35.90 | 36.31 | 36.72 | 37.13 |
| Woodie | 29.20 | 32.28 | 33.67 | 36.74 | 38.13 | 41.21 | 42.60 |
| Fibonacci | 32.56 | 34.27 | 35.32 | 37.03 | 38.73 | 39.78 | 41.49 |
Numerical data
The following are the details of the technical indicators and moving averages that were collected to generate this technical analysis:
| RSI (14): | 58.36 | |
| MACD (12,26,9): | 0.2500 | |
| Directional Movement: | 5.39 | |
| AROON (14): | 78.57 | |
| DEMA (21): | 37.63 | |
| Parabolic SAR (0,02-0,02-0,2): | 37.42 | |
| Elder Ray (13): | 0.43 | |
| Super Trend (3,10): | 37.68 | |
| Zig ZAG (10): | 38.30 | |
| VORTEX (21): | 0.9600 | |
| Stochastique (14,3,5): | 82.72 | |
| TEMA (21): | 38.46 | |
| Williams %R (14): | -25.16 | |
| Chande Momentum Oscillator (20): | 2.34 | |
| Repulse (5,40,3): | 0.9100 | |
| ROCnROLL: | -1 | |
| TRIX (15,9): | -0.0700 | |
| Courbe Coppock: | 13.59 |
| MA7: | 38.39 | |
| MA20: | 36.89 | |
| MA50: | 38.24 | |
| MA100: | 39.72 | |
| MAexp7: | 38.21 | |
| MAexp20: | 37.54 | |
| MAexp50: | 38.09 | |
| MAexp100: | 38.96 | |
| Price / MA7: | -0.23% | |
| Price / MA20: | +3.82% | |
| Price / MA50: | +0.16% | |
| Price / MA100: | -3.58% | |
| Price / MAexp7: | +0.24% | |
| Price / MAexp20: | +2.02% | |
| Price / MAexp50: | +0.55% | |
| Price / MAexp100: | -1.69% |
News
The latest news and videos published on HSBC HOLDINGS PLC. at the time of the analysis were as follows:
- Homesickness in the Modern Age: International Students Crave the Sounds of Home, Says HSBC Survey
- HSBC Bank plc Announces Post Stabilisation Notice
- US Business Leaders Look to Invest in Customer Experience to Propel Future Growth, Says HSBC Survey
- HSBC Holdings PLC Announces Pre Stabilisation Notice
- The Pollution Solution: US Urbanites Flee Cities for Cleaner Air and Improved Mental Health
About author

Online


Add a comment
Comments
0 comments on the analysis HSBC HOLDINGS PLC. - Daily