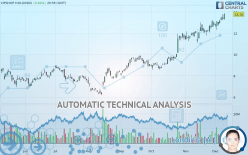
VIPSHOP HOLDINGS - Daily - Technical analysis published on 12/11/2019 (GMT)
- Who voted?
- 387
- 0
Click here for a new analysis!
- Timeframe : Daily
- - Analysis generated on
- Status : TARGET REACHED
Summary of the analysis

Additional analysis
Quotes
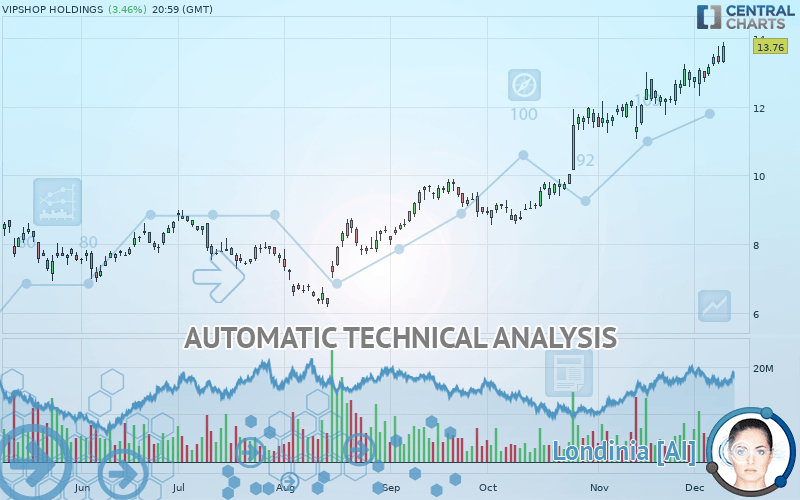
The VIPSHOP HOLDINGS price is 13.76 USD. On the day, this instrument gained +3.46% with the lowest point at 13.28 USD and the highest point at 13.88 USD. The deviation from the price is +3.61% for the low point and -0.86% for the high point.The Central Gaps scanner detects a bullish opening marking the presence of buyers ahead of sellers at the opening but not sufficiently marked to allow the price to register a quotation gap.
Bullish opening
Type : Bullish
Timeframe : Openning
A study of price movements over other periods shows the following variations:
New HIGH record (1 year)
Type : Bullish
Timeframe : Weekly
New HIGH record (1st january)
Type : Bullish
Timeframe : Weekly
New HIGH record (1 month)
Type : Bullish
Timeframe : Weekly
Technical
Technical analysis of this Daily chart of VIPSHOP HOLDINGS indicates that the overall trend is strongly bullish. 92.86% of the signals given by moving averages are bullish. The overall trend is supported by the strong bullish signals from short-term moving averages. The Central Indicators market scanner currently does not detect any result that concerns moving averages.
In fact, 15 technical indicators on 18 studied are currently positioned bullish. Caution: the Central Indicators scanner currently detects an excess:
RSI indicator is overbought : over 70
Type : Neutral
Timeframe : Daily
CCI indicator is overbought : over 100
Type : Neutral
Timeframe : Daily
Williams %R indicator is overbought : over -20
Type : Neutral
Timeframe : Daily
Pivot points : price is over resistance 1
Type : Neutral
Timeframe : Daily
MACD crosses UP its Moving Average
Type : Bullish
Timeframe : Daily
Price is back over the pivot point
Type : Bullish
Timeframe : Weekly
Price is back under the pivot point
Type : Bearish
Timeframe : Daily
Central Patterns, the scanner specializing in chart patterns, did not identify any signals.
No result was found by the Central Candlesticks scanner on Japanese candlesticks.
| S3 | S2 | S1 | Price | R1 | R2 | R3 | |
|---|---|---|---|---|---|---|---|
| ProTrendLines | 9.81 | 11.40 | 12.73 | 13.76 | 14.91 | 16.25 | 18.94 |
| Change (%) | -28.71% | -17.15% | -7.49% | - | +8.36% | +18.10% | +37.65% |
| Change | -3.95 | -2.36 | -1.03 | - | +1.15 | +2.49 | +5.18 |
| Level | Major | Major | Intermediate | - | Minor | Minor | Intermediate |
Pivot points can also be used to set your price objectives. Here is the price situation in relation to pivot points:
| Pivot points | S3 | S2 | S1 | PP | R1 | R2 | R3 |
|---|---|---|---|---|---|---|---|
| Standard | 12.59 | 12.92 | 13.11 | 13.44 | 13.63 | 13.96 | 14.15 |
| Camarilla | 13.16 | 13.21 | 13.25 | 13.30 | 13.35 | 13.40 | 13.44 |
| Woodie | 12.52 | 12.89 | 13.04 | 13.41 | 13.56 | 13.93 | 14.08 |
| Fibonacci | 12.92 | 13.12 | 13.24 | 13.44 | 13.64 | 13.76 | 13.96 |
| Pivot points | S3 | S2 | S1 | PP | R1 | R2 | R3 |
|---|---|---|---|---|---|---|---|
| Standard | 11.42 | 11.86 | 12.65 | 13.09 | 13.88 | 14.32 | 15.11 |
| Camarilla | 13.10 | 13.22 | 13.33 | 13.44 | 13.55 | 13.67 | 13.78 |
| Woodie | 11.60 | 11.95 | 12.83 | 13.18 | 14.06 | 14.41 | 15.29 |
| Fibonacci | 11.86 | 12.33 | 12.62 | 13.09 | 13.56 | 13.85 | 14.32 |
| Pivot points | S3 | S2 | S1 | PP | R1 | R2 | R3 |
|---|---|---|---|---|---|---|---|
| Standard | 9.27 | 10.16 | 11.47 | 12.36 | 13.67 | 14.56 | 15.87 |
| Camarilla | 12.18 | 12.38 | 12.58 | 12.78 | 12.98 | 13.18 | 13.39 |
| Woodie | 9.48 | 10.27 | 11.68 | 12.47 | 13.88 | 14.67 | 16.08 |
| Fibonacci | 10.16 | 11.00 | 11.52 | 12.36 | 13.20 | 13.72 | 14.56 |
Numerical data
The following are the details of the technical indicators and moving averages that were collected to generate this technical analysis:
| RSI (14): | 71.62 | |
| MACD (12,26,9): | 0.6100 | |
| Directional Movement: | 23.12 | |
| AROON (14): | 85.71 | |
| DEMA (21): | 13.48 | |
| Parabolic SAR (0,02-0,02-0,2): | 12.01 | |
| Elder Ray (13): | 0.61 | |
| Super Trend (3,10): | 12.07 | |
| Zig ZAG (10): | 13.76 | |
| VORTEX (21): | 1.1100 | |
| Stochastique (14,3,5): | 88.68 | |
| TEMA (21): | 13.52 | |
| Williams %R (14): | -5.63 | |
| Chande Momentum Oscillator (20): | 1.64 | |
| Repulse (5,40,3): | 4.1400 | |
| ROCnROLL: | 1 | |
| TRIX (15,9): | 0.7400 | |
| Courbe Coppock: | 18.25 |
| MA7: | 13.20 | |
| MA20: | 12.63 | |
| MA50: | 11.19 | |
| MA100: | 9.69 | |
| MAexp7: | 13.25 | |
| MAexp20: | 12.66 | |
| MAexp50: | 11.52 | |
| MAexp100: | 10.35 | |
| Price / MA7: | +4.24% | |
| Price / MA20: | +8.95% | |
| Price / MA50: | +22.97% | |
| Price / MA100: | +42.00% | |
| Price / MAexp7: | +3.85% | |
| Price / MAexp20: | +8.69% | |
| Price / MAexp50: | +19.44% | |
| Price / MAexp100: | +32.95% |
News
The latest news and videos published on VIPSHOP HOLDINGS at the time of the analysis were as follows:
- Vipshop Announces Business Cooperation with SF Holding
- Vipshop Reports Unaudited Third Quarter 2019 Financial Results
- Vipshop to Announce Third Quarter 2019 Financial Results
- Vipshop Holdings Limited to Hold 2019 Annual General Meeting on December 2, 2019
- Vipshop Reports Unaudited Second Quarter 2019 Financial Results
About author

Online


Add a comment
Comments
0 comments on the analysis VIPSHOP HOLDINGS - Daily