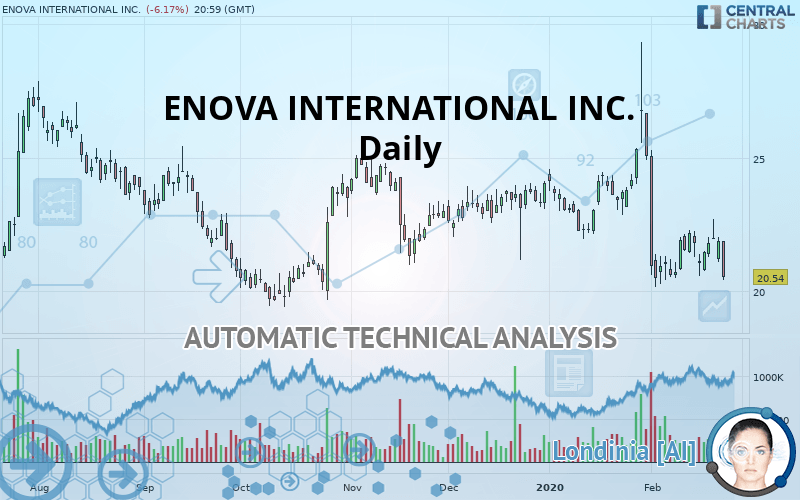
ENOVA INTERNATIONAL INC. - Daily - Technical analysis published on 02/26/2020 (GMT)
- Who voted?
- 295
- 1
Click here for a new analysis!
- Timeframe : Daily
- - Analysis generated on
- Status : TARGET REACHED

Summary of the analysis

Additional analysis
Quotes
The ENOVA INTERNATIONAL INC. price is 20.54 USD. On the day, this instrument lost -6.17% and was between 20.42 USD and 21.86 USD. This implies that the price is at +0.59% from its lowest and at -6.04% from its highest.So that you have an overall view of the price change, here is a table showing the variations over several periods:
Near a new LOW record (1 year)
Type : Bearish
Timeframe : Weekly
Near a new LOW record (1st january)
Type : Bearish
Timeframe : Weekly
Near a new LOW record (1 month)
Type : Bearish
Timeframe : Weekly
Technical
Technical analysis of ENOVA INTERNATIONAL INC. in Daily shows an overall bearish trend. 78.57% of the signals given by moving averages are bearish. This bearish trend is supported by the strong bearish signals given by short-term moving averages. The Central Indicators market scanner currently does not detect any result that concerns moving averages.
In fact, 11 technical indicators on 18 studied are currently positioned bearish. Caution: the Central Indicators scanner currently detects an excess:
MACD indicator: bearish divergence
Type : Bearish
Timeframe : Daily
Williams %R indicator is oversold : under -80
Type : Neutral
Timeframe : Daily
Pivot points : price is under support 1
Type : Neutral
Timeframe : Weekly
Pivot points : price is under support 3
Type : Neutral
Timeframe : Daily
MACD crosses DOWN its Moving Average
Type : Bearish
Timeframe : Daily
Aroon indicator bullish trend
Type : Bullish
Timeframe : Daily
Price is back over the pivot point
Type : Bullish
Timeframe : Daily
Price is back over the pivot point
Type : Bullish
Timeframe : Weekly
Momentum indicator is back under 0
Type : Bearish
Timeframe : Daily
Williams %R indicator is back under -50
Type : Bearish
Timeframe : Daily
No signals are given by Central Patterns, a market scanner specialised in chart patterns, resistances and supports.
No result was found by the Central Candlesticks scanner on Japanese candlesticks.
| S3 | S2 | S1 | Price | R1 | R2 | R3 | |
|---|---|---|---|---|---|---|---|
| ProTrendLines | 13.32 | 19.67 | 20.50 | 20.54 | 21.34 | 22.15 | 24.13 |
| Change (%) | -35.15% | -4.24% | -0.19% | - | +3.89% | +7.84% | +17.48% |
| Change | -7.22 | -0.87 | -0.04 | - | +0.80 | +1.61 | +3.59 |
| Level | Intermediate | Major | Major | - | Minor | Major | Intermediate |
Attention could also be paid to pivot points to set price objectives:
| Pivot points | S3 | S2 | S1 | PP | R1 | R2 | R3 |
|---|---|---|---|---|---|---|---|
| Standard | 20.37 | 20.72 | 21.31 | 21.66 | 22.25 | 22.60 | 23.19 |
| Camarilla | 21.63 | 21.72 | 21.80 | 21.89 | 21.98 | 22.06 | 22.15 |
| Woodie | 20.48 | 20.78 | 21.42 | 21.72 | 22.36 | 22.66 | 23.30 |
| Fibonacci | 20.72 | 21.08 | 21.30 | 21.66 | 22.02 | 22.24 | 22.60 |
| Pivot points | S3 | S2 | S1 | PP | R1 | R2 | R3 |
|---|---|---|---|---|---|---|---|
| Standard | 18.64 | 19.60 | 20.78 | 21.74 | 22.92 | 23.88 | 25.06 |
| Camarilla | 21.38 | 21.58 | 21.77 | 21.97 | 22.17 | 22.36 | 22.56 |
| Woodie | 18.76 | 19.66 | 20.90 | 21.80 | 23.04 | 23.94 | 25.18 |
| Fibonacci | 19.60 | 20.41 | 20.92 | 21.74 | 22.55 | 23.06 | 23.88 |
| Pivot points | S3 | S2 | S1 | PP | R1 | R2 | R3 |
|---|---|---|---|---|---|---|---|
| Standard | 14.15 | 18.04 | 21.55 | 25.44 | 28.95 | 32.84 | 36.35 |
| Camarilla | 23.03 | 23.70 | 24.38 | 25.06 | 25.74 | 26.42 | 27.10 |
| Woodie | 13.96 | 17.95 | 21.36 | 25.35 | 28.76 | 32.75 | 36.16 |
| Fibonacci | 18.04 | 20.87 | 22.61 | 25.44 | 28.27 | 30.01 | 32.84 |
Numerical data
The following are the details of the technical indicators and moving averages that were collected to generate this technical analysis:
| RSI (14): | 39.77 | |
| MACD (12,26,9): | -0.4900 | |
| Directional Movement: | -4.15 | |
| AROON (14): | 85.71 | |
| DEMA (21): | 21.31 | |
| Parabolic SAR (0,02-0,02-0,2): | 25.24 | |
| Elder Ray (13): | -0.53 | |
| Super Trend (3,10): | 24.41 | |
| Zig ZAG (10): | 20.54 | |
| VORTEX (21): | 0.8700 | |
| Stochastique (14,3,5): | 38.28 | |
| TEMA (21): | 21.05 | |
| Williams %R (14): | -89.21 | |
| Chande Momentum Oscillator (20): | -0.47 | |
| Repulse (5,40,3): | -4.7100 | |
| ROCnROLL: | 2 | |
| TRIX (15,9): | -0.3100 | |
| Courbe Coppock: | 9.17 |
| MA7: | 21.50 | |
| MA20: | 22.11 | |
| MA50: | 22.90 | |
| MA100: | 22.59 | |
| MAexp7: | 21.45 | |
| MAexp20: | 21.94 | |
| MAexp50: | 22.51 | |
| MAexp100: | 22.78 | |
| Price / MA7: | -4.47% | |
| Price / MA20: | -7.10% | |
| Price / MA50: | -10.31% | |
| Price / MA100: | -9.07% | |
| Price / MAexp7: | -4.24% | |
| Price / MAexp20: | -6.38% | |
| Price / MAexp50: | -8.75% | |
| Price / MAexp100: | -9.83% |
News
Don"t forget to follow the news on ENOVA INTERNATIONAL INC.. At the time of publication of this analysis, the latest news was as follows:
- Enova To Announce Fourth Quarter and Full Year 2019 Results
- WomenInc. Magazine Names Enova Board Member to 2019 Most Influential Corporate Directors List
- Enova Reports Third Quarter 2019 Results
- Enova To Announce Third Quarter 2019 Results
- Enova Announces Pricing of $200 Million Securitization
About author

Online


Add a comment
Comments
1 comments on the analysis ENOVA INTERNATIONAL INC. - Daily