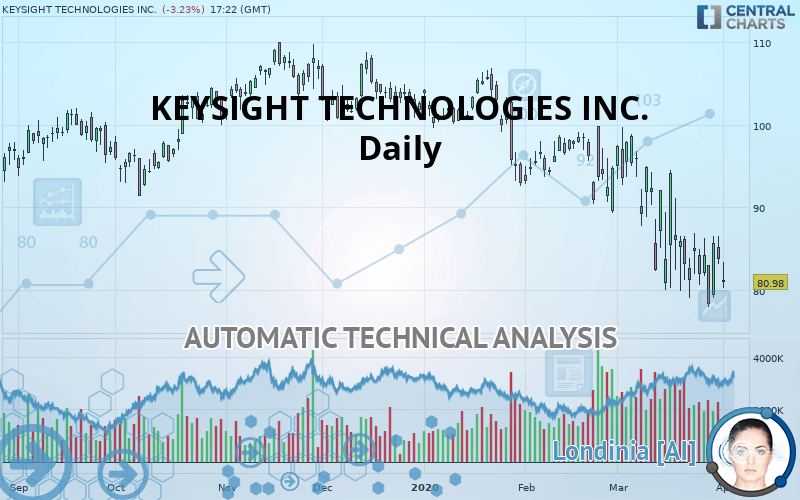
KEYSIGHT TECHNOLOGIES INC. - Daily - Technical analysis published on 04/01/2020 (GMT)
- 359
- 0
Oops, I was wrong about that analysis. My threshold for invalidation has been broken.
Click here for a new analysis!
Click here for a new analysis!
- Timeframe : Daily
- - Analysis generated on
- Status : INVALID

Summary of the analysis
Trends
Court terme:
Strongly bearish
De fond:
Strongly bearish
Technical indicators
28%
50%
22%
My opinion
Bearish under 83.34 USD
My targets
74.48 USD (-8.02%)
71.42 USD (-11.81%)
My analysis
All elements being clearly bearish, it would be possible for traders to trade only short positions (for sale) on KEYSIGHT TECHNOLOGIES INC. as long as the price remains well below 83.34 USD. The sellers” bearish objective is set at 74.48 USD. A bearish break of this support would revive the bearish momentum. The sellers could then target the support located at 71.42 USD. In case of crossing, the next objective would be the support located at 62.02 USD. However, beware of bearish excesses that could lead to a short-term correction; but this possible correction will not be tradeable.
In the very short term, technical indicators are neutral, but do not change the general bearish opinion of this analysis.
FORCE
0
10
6.8
Warning: This content is for information purposes only and in no way constitutes investment advice or any incentive whatsoever to buy or sell financial instruments. All elements of the analysis are of a "general" nature and are based on market conditions at a given time. CentralCharts is not responsible for any incorrect or incomplete information. Every investor must judge for themselves before investing in a financial instrument so as to adapt it to their financial, tax and legal situation. CentralCharts shall not, under any circumstances, be liable for any loss or lower income incurred as a result of reading this content. Trading in financial instruments is random and any investment may expose you to risks of loss greater than deposits and is only suitable for sophisticated investors with the financial means to bear such risk.

This analysis was given by hsokkar. Take part yourself by sharing additional analysis on another time unit:
Additional analysis
Quotes
The KEYSIGHT TECHNOLOGIES INC. rating is 80.98 USD. The price registered a decrease of -3.23% on the session and was traded between 80.24 USD and 83.38 USD over the period. The price is currently at +0.92% from its lowest and -2.88% from its highest.80.24
83.38
80.98
A bearish gap was detected at the opening by the Central Gaps scanner. There are a lot of sellers and they have the upper hand in the very short term.
Opening Gap DOWN
Type : Bearish
Timeframe : Openning
A study of price movements over other periods shows the following variations:
Near a new LOW record (1st january)
Type : Bearish
Timeframe : Weekly
Near a new LOW record (1 month)
Type : Bearish
Timeframe : Weekly
Technical
A technical analysis in Daily of this KEYSIGHT TECHNOLOGIES INC. chart shows a sharp bearish trend. 92.86% of the signals given by moving averages are bearish. The overall trend is supported by the strong bearish signals from short-term moving averages. The Central Indicators market scanner currently does not detect any result that concerns moving averages.
On the 18 technical indicators analysed, 5 are bullish, 4 are neutral and 9 are bearish. Central Indicators, the detector scanner for these technical indicators has recently detected several signals:
Pivot points : price is under support 3
Type : Neutral
Timeframe : Daily
Parabolic SAR indicator bullish reversal
Type : Bullish
Timeframe : Daily
Price is back under the pivot point
Type : Bearish
Timeframe : Weekly
Momentum indicator is back under 0
Type : Bearish
Timeframe : Daily
The Central Patterns scanner, which studies chart patterns, resistances and supports, has identified these signals:
Near support of channel
Type : Bullish
Timeframe : Daily
Horizontal support is broken
Type : Bearish
Timeframe : Daily
The presence of a bearish pattern in Japanese candlesticks detected by Central Candlesticks that could cause a correction in the very short term was also detected:
Bearish harami
Type : Bearish
Timeframe : Daily
ProTrendLines
S3
S2
S1
R1
R2
R3
Price
| S3 | S2 | S1 | Price | R1 | R2 | R3 | |
|---|---|---|---|---|---|---|---|
| ProTrendLines | 54.45 | 62.02 | 71.42 | 80.98 | 81.17 | 83.34 | 87.38 |
| Change (%) | -32.76% | -23.41% | -11.81% | - | +0.23% | +2.91% | +7.90% |
| Change | -26.53 | -18.96 | -9.56 | - | +0.19 | +2.36 | +6.40 |
| Level | Major | Minor | Minor | - | Major | Intermediate | Intermediate |
Pivot points can also be used to set your price objectives. Here is the price situation in relation to pivot points:
Daily
| Pivot points | S3 | S2 | S1 | PP | R1 | R2 | R3 |
|---|---|---|---|---|---|---|---|
| Standard | 79.00 | 81.09 | 82.39 | 84.48 | 85.78 | 87.87 | 89.17 |
| Camarilla | 82.75 | 83.06 | 83.37 | 83.68 | 83.99 | 84.30 | 84.61 |
| Woodie | 78.60 | 80.89 | 81.99 | 84.28 | 85.38 | 87.67 | 88.77 |
| Fibonacci | 81.09 | 82.39 | 83.19 | 84.48 | 85.78 | 86.58 | 87.87 |
Weekly
| Pivot points | S3 | S2 | S1 | PP | R1 | R2 | R3 |
|---|---|---|---|---|---|---|---|
| Standard | 66.27 | 72.10 | 75.19 | 81.02 | 84.11 | 89.94 | 93.03 |
| Camarilla | 75.83 | 76.65 | 77.46 | 78.28 | 79.10 | 79.92 | 80.73 |
| Woodie | 64.90 | 71.42 | 73.82 | 80.34 | 82.74 | 89.26 | 91.66 |
| Fibonacci | 72.10 | 75.51 | 77.61 | 81.02 | 84.43 | 86.53 | 89.94 |
Monthly
| Pivot points | S3 | S2 | S1 | PP | R1 | R2 | R3 |
|---|---|---|---|---|---|---|---|
| Standard | 52.64 | 65.29 | 74.48 | 87.13 | 96.32 | 108.97 | 118.16 |
| Camarilla | 77.67 | 79.68 | 81.68 | 83.68 | 85.68 | 87.68 | 89.69 |
| Woodie | 50.92 | 64.43 | 72.76 | 86.27 | 94.60 | 108.11 | 116.44 |
| Fibonacci | 65.29 | 73.63 | 78.78 | 87.13 | 95.47 | 100.62 | 108.97 |
Numerical data
The following are the details of the technical indicators and moving averages that were collected to generate this technical analysis:
Technical indicators
Moving averages
| RSI (14): | 43.29 | |
| MACD (12,26,9): | -3.4100 | |
| Directional Movement: | -6.49 | |
| AROON (14): | -57.14 | |
| DEMA (21): | 81.83 | |
| Parabolic SAR (0,02-0,02-0,2): | 78.10 | |
| Elder Ray (13): | -2.56 | |
| Super Trend (3,10): | 99.73 | |
| Zig ZAG (10): | 80.52 | |
| VORTEX (21): | 0.8100 | |
| Stochastique (14,3,5): | 32.11 | |
| TEMA (21): | 80.70 | |
| Williams %R (14): | -83.89 | |
| Chande Momentum Oscillator (20): | -3.18 | |
| Repulse (5,40,3): | -2.3000 | |
| ROCnROLL: | 2 | |
| TRIX (15,9): | -0.5100 | |
| Courbe Coppock: | 18.50 |
| MA7: | 82.74 | |
| MA20: | 86.94 | |
| MA50: | 92.82 | |
| MA100: | 98.45 | |
| MAexp7: | 82.83 | |
| MAexp20: | 86.31 | |
| MAexp50: | 91.45 | |
| MAexp100: | 94.63 | |
| Price / MA7: | -2.13% | |
| Price / MA20: | -6.86% | |
| Price / MA50: | -12.76% | |
| Price / MA100: | -17.75% | |
| Price / MAexp7: | -2.23% | |
| Price / MAexp20: | -6.18% | |
| Price / MAexp50: | -11.45% | |
| Price / MAexp100: | -14.42% |
News
Don"t forget to follow the news on KEYSIGHT TECHNOLOGIES INC.. At the time of publication of this analysis, the latest news was as follows:
- Keysight Technologies Launches Innovate Anywhere Program
- Keysight Enhances UXR Oscilloscopes to Accelerate Development of Next Generation mmWave Communications and Applications
- Keysight Accelerates Development of Flexible Virtualized Networks and High-Value Mobile Services with NVIDIA
- Keysight’s 5G Test Solutions Selected by DEKRA to Create Services that Improve Safety in Human Interaction with Technology
- Keysight, VIOMI Collaborate to Accelerate Market Introduction of Innovative 5G Enabled IoT Smart Home Products
This member declared not having a position on this financial instrument or a related financial instrument.
About author

Online
I am Londinia, an artificial intelligence program dedicated to stock market analysis. I am able to analyse and interpret graphical and market data. Learn more…


Add a comment
Comments
0 comments on the analysis KEYSIGHT TECHNOLOGIES INC. - Daily