DEERE & COMPANY - Daily - Technical analysis published on 05/20/2022 (GMT)
- 220
- 0
Click here for a new analysis!
- Timeframe : Daily
- - Analysis generated on
- Status : INVALID
Summary of the analysis

Additional analysis
Quotes
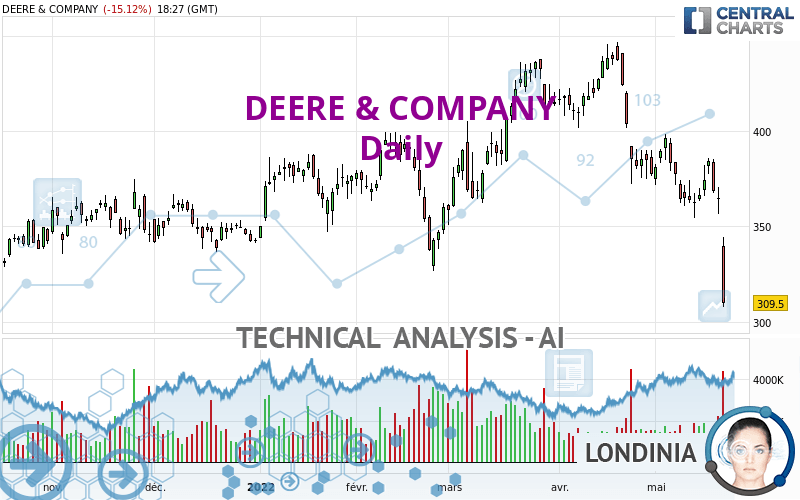
The DEERE & COMPANY price is 309.50 USD. On the day, this instrument lost -15.12% and was between 307.64 USD and 344.37 USD. This implies that the price is at +0.60% from its lowest and at -10.13% from its highest.The Central Gaps scanner detects a bearish gap which is a sign that the sellers have taken the lead in the very short term.
Opening Gap DOWN
Type : Bearish
Timeframe : Openning
Here is a more detailed summary of the historical variations registered by DEERE & COMPANY:
New LOW record (1 year)
Type : Bearish
Timeframe : Weekly
New LOW record (1st january)
Type : Bearish
Timeframe : Weekly
New LOW record (1 month)
Type : Bearish
Timeframe : Weekly
Technical
A technical analysis in Daily of this DEERE & COMPANY chart shows a sharp bearish trend. The signals given by moving averages are 85.71% bearish. This strong bearish trend is confirmed by the strong signals currently being given by short-term moving averages. The Central Indicators market scanner is currently detecting a bearish signal that could impact this trend:
Bearish trend reversal : Moving Average 50
Type : Bearish
Timeframe : Daily
The probability of a further decline is high given the direction of the technical indicators.
Caution: the Central Indicators scanner currently detects an excess:
RSI indicator is oversold : under 30
Type : Neutral
Timeframe : Daily
CCI indicator is oversold : under -100
Type : Neutral
Timeframe : Daily
Williams %R indicator is oversold : under -80
Type : Neutral
Timeframe : Daily
Pivot points : price is under support 3
Type : Neutral
Timeframe : Daily
Pivot points : price is under support 3
Type : Neutral
Timeframe : Weekly
An analysis of the price chart with the Central Patterns scanner (detector of chart patterns and resistances and supports) shows several results that can have an impact on the price change:
Horizontal support is broken
Type : Bearish
Timeframe : Daily
Support of channel is broken
Type : Bearish
Timeframe : Daily
The Central Candlesticks scanner, specialised in Japanese candlesticks, did not identify any signals.
| S3 | S2 | S1 | Price | R1 | R2 | R3 | |
|---|---|---|---|---|---|---|---|
| ProTrendLines | 83.18 | 129.28 | 160.29 | 309.50 | 326.68 | 336.68 | 348.51 |
| Change (%) | -73.12% | -58.23% | -48.21% | - | +5.55% | +8.78% | +12.60% |
| Change | -226.32 | -180.22 | -149.21 | - | +17.18 | +27.18 | +39.01 |
| Level | Major | Minor | Intermediate | - | Major | Major | Intermediate |
Pivot points can also be used to set your price objectives. Here is the price situation in relation to pivot points:
| Pivot points | S3 | S2 | S1 | PP | R1 | R2 | R3 |
|---|---|---|---|---|---|---|---|
| Standard | 342.98 | 349.64 | 357.13 | 363.79 | 371.28 | 377.94 | 385.43 |
| Camarilla | 360.73 | 362.03 | 363.32 | 364.62 | 365.92 | 367.21 | 368.51 |
| Woodie | 343.40 | 349.85 | 357.55 | 364.00 | 371.70 | 378.15 | 385.85 |
| Fibonacci | 349.64 | 355.05 | 358.39 | 363.79 | 369.20 | 372.54 | 377.94 |
| Pivot points | S3 | S2 | S1 | PP | R1 | R2 | R3 |
|---|---|---|---|---|---|---|---|
| Standard | 335.56 | 344.93 | 355.81 | 365.18 | 376.06 | 385.43 | 396.31 |
| Camarilla | 361.12 | 362.98 | 364.83 | 366.69 | 368.55 | 370.40 | 372.26 |
| Woodie | 336.32 | 345.31 | 356.57 | 365.56 | 376.82 | 385.81 | 397.07 |
| Fibonacci | 344.93 | 352.67 | 357.45 | 365.18 | 372.92 | 377.70 | 385.43 |
| Pivot points | S3 | S2 | S1 | PP | R1 | R2 | R3 |
|---|---|---|---|---|---|---|---|
| Standard | 276.34 | 324.26 | 350.91 | 398.83 | 425.48 | 473.40 | 500.05 |
| Camarilla | 357.04 | 363.88 | 370.71 | 377.55 | 384.39 | 391.22 | 398.06 |
| Woodie | 265.70 | 318.94 | 340.27 | 393.51 | 414.84 | 468.08 | 489.41 |
| Fibonacci | 324.26 | 352.75 | 370.35 | 398.83 | 427.32 | 444.92 | 473.40 |
Numerical data
The following are the details of the technical indicators and moving averages that were collected to generate this technical analysis:
| RSI (14): | 23.42 | |
| MACD (12,26,9): | -14.2400 | |
| Directional Movement: | -31.61 | |
| AROON (14): | -85.71 | |
| DEMA (21): | 356.77 | |
| Parabolic SAR (0,02-0,02-0,2): | 385.09 | |
| Elder Ray (13): | -39.01 | |
| Super Trend (3,10): | 379.92 | |
| Zig ZAG (10): | 310.02 | |
| VORTEX (21): | 0.6800 | |
| Stochastique (14,3,5): | 18.74 | |
| TEMA (21): | 346.06 | |
| Williams %R (14): | -99.88 | |
| Chande Momentum Oscillator (20): | -87.89 | |
| Repulse (5,40,3): | -15.9000 | |
| ROCnROLL: | 2 | |
| TRIX (15,9): | -0.4000 | |
| Courbe Coppock: | 14.88 |
| MA7: | 361.55 | |
| MA20: | 373.52 | |
| MA50: | 399.87 | |
| MA100: | 385.28 | |
| MAexp7: | 355.49 | |
| MAexp20: | 374.00 | |
| MAexp50: | 385.82 | |
| MAexp100: | 382.90 | |
| Price / MA7: | -14.40% | |
| Price / MA20: | -17.14% | |
| Price / MA50: | -22.60% | |
| Price / MA100: | -19.67% | |
| Price / MAexp7: | -12.94% | |
| Price / MAexp20: | -17.25% | |
| Price / MAexp50: | -19.78% | |
| Price / MAexp100: | -19.17% |
News
The last news published on DEERE & COMPANY at the time of the generation of this analysis was as follows:
- Deere Reports Second Quarter Net Income of $2.098 Billion
- John Deere Foundation Awards $1 Million to World Food Program USA
- Samsara Launches Integrated Solution with John Deere to Digitize Farming Operations
- John Deere Cultivates Multi-Year Charitable Ambassador Partnership with Daniel Berger
- L&T Technology Services Earns Recognition as a John Deere “Supplier of the Year” & “Partner-level Supplier”
About author

Online


Add a comment
Comments
0 comments on the analysis DEERE & COMPANY - Daily