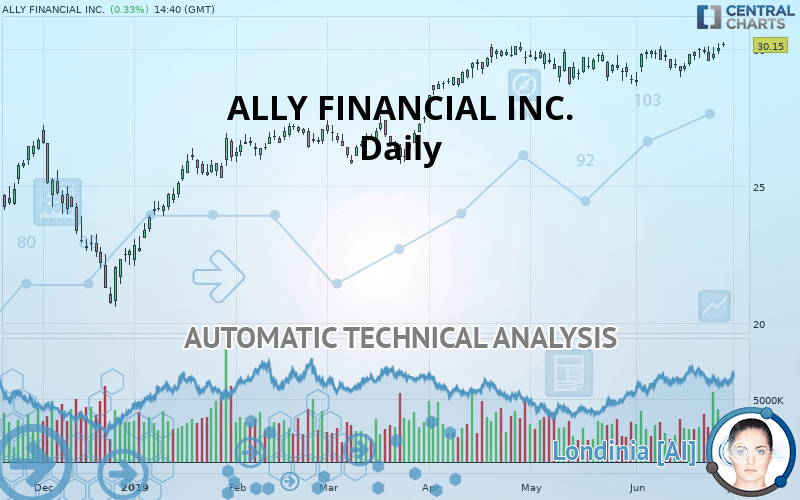
ALLY FINANCIAL INC. - Daily - Technical analysis published on 06/27/2019 (GMT)
- Who voted?
- 323
- 0
Click here for a new analysis!
- Timeframe : Daily
- - Analysis generated on
- Status : TARGET REACHED

Summary of the analysis

Additional analysis
Quotes
The ALLY FINANCIAL INC. price is 30.15 USD. The price has increased by +0.33% since the last closing with the lowest point at 30.09 USD and the highest point at 30.27 USD. The deviation from the price is +0.20% for the low point and -0.40% for the high point.The Central Gaps scanner detects a bullish opening. A small advantage for buyers in the very short term.
Bullish opening
Type : Bullish
Timeframe : Openning
A study of price movements over other periods shows the following variations:
Near a new HIGH record (5 years)
Type : Bullish
Timeframe : Weekly
New HIGH record (1 year)
Type : Bullish
Timeframe : Weekly
New HIGH record (1st january)
Type : Bullish
Timeframe : Weekly
New HIGH record (1 month)
Type : Bullish
Timeframe : Weekly
Near a new LOW record (1 month)
Type : Bearish
Timeframe : Weekly
Technical
Technical analysis of this Daily chart of ALLY FINANCIAL INC. indicates that the overall trend is strongly bullish. 92.86% of the signals given by moving averages are bullish. The overall trend is supported by the strong bullish signals from short-term moving averages. There is no crossing of moving average by the price or crossing of moving averages between themselves.
An assessment of technical indicators shows a strong bullish signal.
Caution: the Central Indicators scanner currently detects an excess:
CCI indicator is overbought : over 100
Type : Neutral
Timeframe : Daily
Williams %R indicator is overbought : over -20
Type : Neutral
Timeframe : Daily
Price is back over the pivot point
Type : Bullish
Timeframe : Daily
Price is back over the pivot point
Type : Bullish
Timeframe : Weekly
Momentum indicator is back over 0
Type : Bullish
Timeframe : Daily
The Central Patterns scanner, which studies chart patterns, resistances and supports, has identified these signals:
Horizontal resistance is broken
Type : Bullish
Timeframe : Daily
Resistance of channel is broken
Type : Bullish
Timeframe : Daily
Resistance of triangle is broken
Type : Bullish
Timeframe : Daily
No result was found by the Central Candlesticks scanner on Japanese candlesticks.
| S3 | S2 | S1 | Price | R1 | |
|---|---|---|---|---|---|
| ProTrendLines | 26.69 | 29.21 | 30.12 | 30.15 | 30.83 |
| Change (%) | -11.48% | -3.12% | -0.10% | - | +2.26% |
| Change | -3.46 | -0.94 | -0.03 | - | +0.68 |
| Level | Intermediate | Major | Major | - | Intermediate |
Pivot points can also be used to set your price objectives. Here is the price situation in relation to pivot points:
| Pivot points | S3 | S2 | S1 | PP | R1 | R2 | R3 |
|---|---|---|---|---|---|---|---|
| Standard | 29.43 | 29.64 | 29.84 | 30.05 | 30.25 | 30.46 | 30.66 |
| Camarilla | 29.94 | 29.97 | 30.01 | 30.05 | 30.09 | 30.13 | 30.16 |
| Woodie | 29.43 | 29.64 | 29.84 | 30.05 | 30.25 | 30.46 | 30.67 |
| Fibonacci | 29.64 | 29.79 | 29.89 | 30.05 | 30.20 | 30.30 | 30.46 |
| Pivot points | S3 | S2 | S1 | PP | R1 | R2 | R3 |
|---|---|---|---|---|---|---|---|
| Standard | 28.48 | 28.84 | 29.37 | 29.74 | 30.27 | 30.63 | 31.16 |
| Camarilla | 29.65 | 29.74 | 29.82 | 29.90 | 29.98 | 30.06 | 30.15 |
| Woodie | 28.56 | 28.88 | 29.45 | 29.78 | 30.35 | 30.67 | 31.24 |
| Fibonacci | 28.84 | 29.19 | 29.40 | 29.74 | 30.08 | 30.29 | 30.63 |
Numerical data
The following is the status of the technical indicators and moving averages at the time of publication of this technical analysis:
| RSI (14): | 59.33 | |
| MACD (12,26,9): | 0.1600 | |
| Directional Movement: | 5.16 | |
| AROON (14): | 64.29 | |
| DEMA (21): | 29.91 | |
| Parabolic SAR (0,02-0,02-0,2): | 29.26 | |
| Elder Ray (13): | 0.39 | |
| Super Trend (3,10): | 28.95 | |
| Zig ZAG (10): | 30.18 | |
| VORTEX (21): | 1.0700 | |
| Stochastique (14,3,5): | 84.03 | |
| TEMA (21): | 29.92 | |
| Williams %R (14): | -5.45 | |
| Chande Momentum Oscillator (20): | 0.47 | |
| Repulse (5,40,3): | -0.1200 | |
| ROCnROLL: | 1 | |
| TRIX (15,9): | 0.0500 | |
| Courbe Coppock: | 2.20 |
| MA7: | 29.90 | |
| MA20: | 29.65 | |
| MA50: | 29.58 | |
| MA100: | 28.34 | |
| MAexp7: | 29.90 | |
| MAexp20: | 29.71 | |
| MAexp50: | 29.29 | |
| MAexp100: | 28.43 | |
| Price / MA7: | +0.84% | |
| Price / MA20: | +1.69% | |
| Price / MA50: | +1.93% | |
| Price / MA100: | +6.39% | |
| Price / MAexp7: | +0.84% | |
| Price / MAexp20: | +1.48% | |
| Price / MAexp50: | +2.94% | |
| Price / MAexp100: | +6.05% |
News
Don"t forget to follow the news on ALLY FINANCIAL INC.. At the time of publication of this analysis, the latest news was as follows:
- Ally Financial Schedules Release of Second Quarter Financial Results
- Ally Home Asked Americans, "How Close is too Close When it Comes to Living Near Your Family?"
- Ally Invest Offers Investors Tax-Optimized and Income-Focused Investment Options with Expanded Set of Digital Managed Portfolio Offerings
- Ally and Jimmie Johnson Honor Military Heroes
- Ally Bank Celebrates 10 Years of 'Doing It Right' for Customers
About author

Online


Add a comment
Comments
0 comments on the analysis ALLY FINANCIAL INC. - Daily