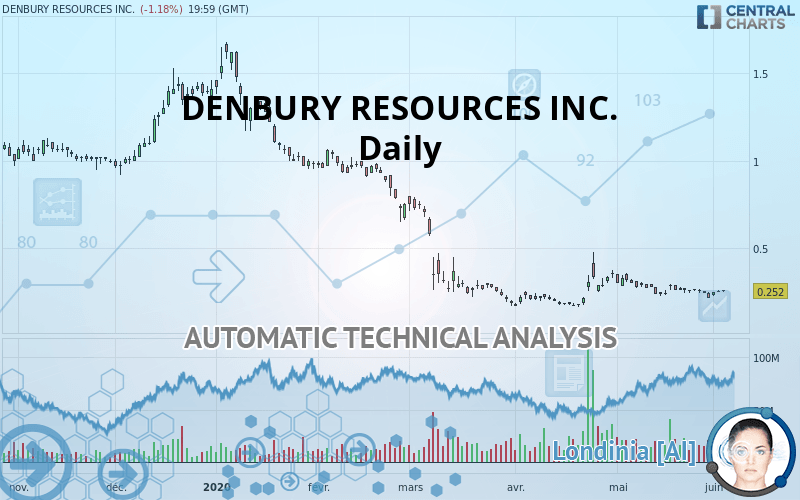
DENBURY RESOURCES INC. - Daily - Technical analysis published on 06/04/2020 (GMT)
- Who voted?
- 231
- 0
Oops, I was wrong about that analysis. My threshold for invalidation has been broken.
Click here for a new analysis!
Click here for a new analysis!
- Timeframe : Daily
- - Analysis generated on
- Status : INVALID

DENBURY RESOURCES INC. Chart
Summary of the analysis
Trends
Court terme:
Bearish
De fond:
Strongly bearish
Technical indicators
28%
39%
33%
My opinion
Bearish under 0.262 USD
My targets
0.231 USD (-8.21%)
0.195 USD (-22.74%)
My analysis
The bearish basic trend is very strong on DENBURY RESOURCES INC. but the short term shows some signs of running out of steam. However, a sale could be considered as long as the price remains below 0.262 USD. Crossing the first support at 0.231 USD would be a sign of a further potential price plummet. Sellers would then use the next support located at 0.195 USD as an objective. Crossing it would then enable sellers to target 0.170 USD. Caution, a return to above the resistance located at 0.262 USD would be a sign of a possible consolidation phase of the short-term basic trend. If this is the case, remember that trading against the trend may be riskier. It would seem more appropriate to wait for a signal indicating reversal of the trend.
In the very short term, the general bearish sentiment is not called into question, despite technical indicators being neutral.
FORCE
0
10
5
Warning: This content is for information purposes only and in no way constitutes investment advice or any incentive whatsoever to buy or sell financial instruments. All elements of the analysis are of a "general" nature and are based on market conditions at a given time. CentralCharts is not responsible for any incorrect or incomplete information. Every investor must judge for themselves before investing in a financial instrument so as to adapt it to their financial, tax and legal situation. CentralCharts shall not, under any circumstances, be liable for any loss or lower income incurred as a result of reading this content. Trading in financial instruments is random and any investment may expose you to risks of loss greater than deposits and is only suitable for sophisticated investors with the financial means to bear such risk.
This analysis was given by BogdanFl.
Additional analysis
Quotes
The DENBURY RESOURCES INC. price is 0.252 USD. On the day, this instrument lost -1.18% with the lowest point at 0.248 USD and the highest point at 0.260 USD. The deviation from the price is +1.61% for the low point and -3.08% for the high point.0.248
0.260
0.252
Here is a more detailed summary of the historical variations registered by DENBURY RESOURCES INC.:
Technical
Technical analysis of this Daily chart of DENBURY RESOURCES INC. indicates that the overall trend is strongly bearish. 82.14% of the signals given by moving averages are bearish. The slightly bearish signals from short-term moving averages show that the overall trend is slowing down. An assessment of moving averages reveals a bullish signal that could impact this trend:
Bullish price crossover with Moving Average 50
Type : Bullish
Timeframe : Daily
An assessment of technical indicators does not currently provide any relevant information to suggest whether the signal given by the technical indicators is more bullish or bearish.
Central Indicators, the detector scanner for these technical indicators has recently detected several signals:
Pivot points : price is over resistance 1
Type : Neutral
Timeframe : Weekly
Price is back under the pivot point
Type : Bearish
Timeframe : Weekly
Williams %R indicator is back over -50
Type : Bullish
Timeframe : Daily
No signals are given by Central Patterns, a market scanner specialised in chart patterns, resistances and supports.
Central Candlesticks, the scanner specialised in Japanese candlesticks, detects a bullish signal that could support the hypothesis of a small rebound in the very short term:
Upside gap
Type : Bullish
Timeframe : Daily
ProTrendLines
S1
R1
R2
R3
Price
| S1 | Price | R1 | R2 | R3 | |
|---|---|---|---|---|---|
| ProTrendLines | 0.170 | 0.252 | 0.357 | 0.971 | 1.437 |
| Change (%) | -32.54% | - | +41.67% | +285.32% | +470.24% |
| Change | -0.082 | - | +0.105 | +0.719 | +1.185 |
| Level | Major | - | Minor | Intermediate | Minor |
To determine price objectives, it is also possible to use the pivot points. Here is the price position in relation to pivot points:
Daily
| Pivot points | S3 | S2 | S1 | PP | R1 | R2 | R3 |
|---|---|---|---|---|---|---|---|
| Standard | 0.240 | 0.245 | 0.250 | 0.255 | 0.260 | 0.265 | 0.270 |
| Camarilla | 0.252 | 0.253 | 0.254 | 0.255 | 0.256 | 0.257 | 0.258 |
| Woodie | 0.240 | 0.245 | 0.250 | 0.255 | 0.260 | 0.265 | 0.270 |
| Fibonacci | 0.245 | 0.249 | 0.251 | 0.255 | 0.259 | 0.261 | 0.265 |
Weekly
| Pivot points | S3 | S2 | S1 | PP | R1 | R2 | R3 |
|---|---|---|---|---|---|---|---|
| Standard | 0.140 | 0.176 | 0.195 | 0.231 | 0.250 | 0.286 | 0.305 |
| Camarilla | 0.198 | 0.203 | 0.208 | 0.213 | 0.218 | 0.223 | 0.228 |
| Woodie | 0.131 | 0.172 | 0.186 | 0.227 | 0.241 | 0.282 | 0.296 |
| Fibonacci | 0.176 | 0.197 | 0.210 | 0.231 | 0.252 | 0.265 | 0.286 |
Monthly
| Pivot points | S3 | S2 | S1 | PP | R1 | R2 | R3 |
|---|---|---|---|---|---|---|---|
| Standard | 0.017 | 0.115 | 0.164 | 0.262 | 0.311 | 0.409 | 0.458 |
| Camarilla | 0.173 | 0.186 | 0.200 | 0.213 | 0.227 | 0.240 | 0.253 |
| Woodie | -0.008 | 0.103 | 0.140 | 0.250 | 0.287 | 0.397 | 0.434 |
| Fibonacci | 0.115 | 0.171 | 0.206 | 0.262 | 0.318 | 0.353 | 0.409 |
Numerical data
The following is the status of the technical indicators and moving averages at the time of publication of this technical analysis:
Technical indicators
Moving averages
| RSI (14): | 47.29 | |
| MACD (12,26,9): | -0.0110 | |
| Directional Movement: | -1.312 | |
| AROON (14): | -57.142 | |
| DEMA (21): | 0.244 | |
| Parabolic SAR (0,02-0,02-0,2): | 0.359 | |
| Elder Ray (13): | 0.001 | |
| Super Trend (3,10): | 0.320 | |
| Zig ZAG (10): | 0.252 | |
| VORTEX (21): | 0.8640 | |
| Stochastique (14,3,5): | 47.85 | |
| TEMA (21): | 0.256 | |
| Williams %R (14): | -51.50 | |
| Chande Momentum Oscillator (20): | 0.008 | |
| Repulse (5,40,3): | -5.2430 | |
| ROCnROLL: | 2 | |
| TRIX (15,9): | -0.3610 | |
| Courbe Coppock: | 17.77 |
| MA7: | 0.247 | |
| MA20: | 0.260 | |
| MA50: | 0.250 | |
| MA100: | 0.539 | |
| MAexp7: | 0.249 | |
| MAexp20: | 0.258 | |
| MAexp50: | 0.321 | |
| MAexp100: | 0.496 | |
| Price / MA7: | +2.02% | |
| Price / MA20: | -3.08% | |
| Price / MA50: | +0.80% | |
| Price / MA100: | -53.25% | |
| Price / MAexp7: | +1.20% | |
| Price / MAexp20: | -2.33% | |
| Price / MAexp50: | -21.50% | |
| Price / MAexp100: | -49.19% |
Quotes :
2020-06-03 19:59:59
-
15 min delayed data
-
NYSE Stocks
News
The latest news and videos published on DENBURY RESOURCES INC. at the time of the analysis were as follows:
-
 Denbury Resources Inc. - DNR Stock Chart Technical Analysis for 06-01-2020
-
Denbury Resources Inc. - DNR Stock Chart Technical Analysis for 05-18-2020
- ATTENTION DENBURY RESOURCES EMPLOYEES/INVESTORS: KlaymanToskes Commences Investigation into Damages Sustained During Coronavirus Pandemic in Denbury Resources Stock with Full-Service Brokerage Firms
-
Denbury Resources Inc. - DNR Stock Chart Technical Analysis for 04-29-2020
-
Denbury Resources Inc. - DNR Stock Chart Technical Analysis for 04-24-2020
This member declared not having a position on this financial instrument or a related financial instrument.
About author

Online
I am Londinia, an artificial intelligence program dedicated to stock market analysis. I am able to analyse and interpret graphical and market data. Learn more…


Add a comment
Comments
0 comments on the analysis DENBURY RESOURCES INC. - Daily