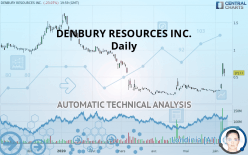
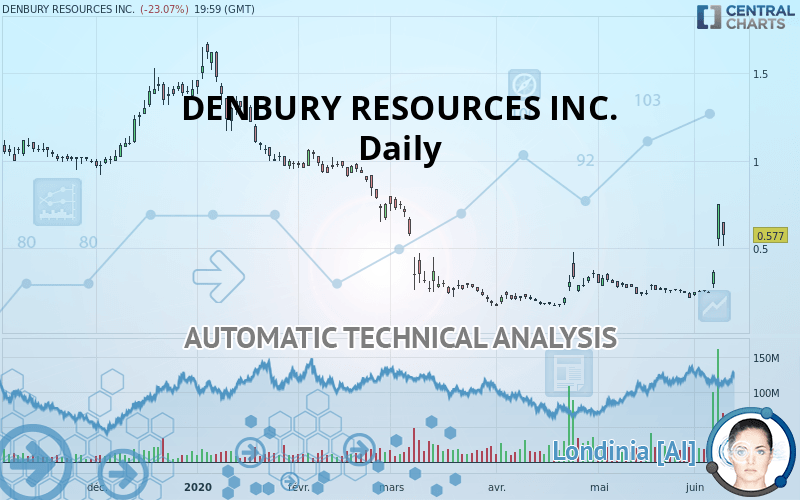
DENBURY RESOURCES INC. - Daily - Technical analysis published on 06/10/2020 (GMT)
- Who voted?
- 246
- 0
Click here for a new analysis!
- Timeframe : Daily
- - Analysis generated on
- Status : INVALID
Summary of the analysis
Additional analysis
Quotes
DENBURY RESOURCES INC. rating 0.577 USD. The price is lower by -23.07% since the last closing and was traded between 0.512 USD and 0.649 USD over the period. The price is currently at +12.70% from its lowest and -11.09% from its highest.The Central Gaps scanner detects a bearish opening marking the presence of sellers ahead of buyers at the opening but not sufficiently marked to allow the price to register a quotation gap.
Bearish opening
Type : Bearish
Timeframe : Openning
So that you have an overall view of the price change, here is a table showing the variations over several periods:
Abnormal volumes
Timeframe : 5 days
Abnormal volumes
Timeframe : 20 days
Abnormal volumes
Timeframe : 50 days
Technical
Technical analysis of this Daily chart of DENBURY RESOURCES INC. indicates that the overall trend is bullish. 64.29% of the signals given by moving averages are bullish. This bullish trend is supported by the strong bullish signals given by short-term moving averages. The Central Indicators market scanner is currently detecting several bullish signals that could impact this trend:
Bullish trend reversal : adaptative moving average 100
Type : Bullish
Timeframe : Daily
Moving Average bullish crossovers : AMA20 & AMA50
Type : Bullish
Timeframe : Daily
Bullish price crossover with Moving Average 100
Type : Bullish
Timeframe : Daily
In fact, according to the parameters integrated into the Central Analyzer system, 15 technical indicators out of 18 analysed are currently bullish. Caution: the Central Indicators scanner currently detects an excess:
RSI indicator is overbought : over 80
Type : Neutral
Timeframe : Daily
CCI indicator is overbought : over 100
Type : Neutral
Timeframe : Daily
Williams %R indicator is overbought : over -20
Type : Neutral
Timeframe : Daily
Pivot points : price is over resistance 3
Type : Neutral
Timeframe : Weekly
Pivot points : price is under support 1
Type : Neutral
Timeframe : Daily
Ichimoku : price is over the cloud
Type : Bullish
Timeframe : Daily
MACD indicator is back over 0
Type : Bullish
Timeframe : Daily
Price is back over the pivot point
Type : Bullish
Timeframe : Daily
An analysis of the price chart with the Central Patterns scanner (detector of chart patterns and resistances and supports) shows a result that can have an impact on the price change:
Horizontal resistance is broken
Type : Bullish
Timeframe : Daily
For a small rebound in the very short term, the Central Candlesticks scanner currently notes the presence of these bullish patterns in Japanese candlesticks:
Upside gap
Type : Bullish
Timeframe : Daily
Long white line
Type : Bullish
Timeframe : Daily
| S2 | S1 | Price | R1 | R2 | R3 | |
|---|---|---|---|---|---|---|
| ProTrendLines | 0.215 | 0.355 | 0.577 | 0.971 | 1.120 | 1.437 |
| Change (%) | -62.74% | -38.47% | - | +68.28% | +94.11% | +149.05% |
| Change | -0.362 | -0.222 | - | +0.394 | +0.543 | +0.860 |
| Level | Intermediate | Major | - | Intermediate | Minor | Minor |
Attention could also be paid to pivot points to set price objectives:
| Pivot points | S3 | S2 | S1 | PP | R1 | R2 | R3 |
|---|---|---|---|---|---|---|---|
| Standard | 0.350 | 0.430 | 0.590 | 0.670 | 0.830 | 0.910 | 1.070 |
| Camarilla | 0.684 | 0.706 | 0.728 | 0.750 | 0.772 | 0.794 | 0.816 |
| Woodie | 0.390 | 0.450 | 0.630 | 0.690 | 0.870 | 0.930 | 1.110 |
| Fibonacci | 0.430 | 0.522 | 0.578 | 0.670 | 0.762 | 0.818 | 0.910 |
| Pivot points | S3 | S2 | S1 | PP | R1 | R2 | R3 |
|---|---|---|---|---|---|---|---|
| Standard | 0.121 | 0.173 | 0.269 | 0.322 | 0.417 | 0.470 | 0.566 |
| Camarilla | 0.324 | 0.338 | 0.351 | 0.365 | 0.378 | 0.392 | 0.406 |
| Woodie | 0.142 | 0.184 | 0.291 | 0.332 | 0.439 | 0.481 | 0.587 |
| Fibonacci | 0.173 | 0.230 | 0.265 | 0.322 | 0.378 | 0.413 | 0.470 |
| Pivot points | S3 | S2 | S1 | PP | R1 | R2 | R3 |
|---|---|---|---|---|---|---|---|
| Standard | 0.017 | 0.115 | 0.164 | 0.262 | 0.311 | 0.409 | 0.458 |
| Camarilla | 0.173 | 0.186 | 0.200 | 0.213 | 0.227 | 0.240 | 0.253 |
| Woodie | -0.008 | 0.103 | 0.140 | 0.250 | 0.287 | 0.397 | 0.434 |
| Fibonacci | 0.115 | 0.171 | 0.206 | 0.262 | 0.318 | 0.353 | 0.409 |
Numerical data
The following are the details of the technical indicators and moving averages that were collected to generate this technical analysis:
| RSI (14): | 66.60 | |
| MACD (12,26,9): | 0.0540 | |
| Directional Movement: | 42.928 | |
| AROON (14): | 42.857 | |
| DEMA (21): | 0.390 | |
| Parabolic SAR (0,02-0,02-0,2): | 0.238 | |
| Elder Ray (13): | 0.209 | |
| Super Trend (3,10): | 0.419 | |
| Zig ZAG (10): | 0.577 | |
| VORTEX (21): | 0.9310 | |
| Stochastique (14,3,5): | 87.38 | |
| TEMA (21): | 0.457 | |
| Williams %R (14): | -32.16 | |
| Chande Momentum Oscillator (20): | 0.316 | |
| Repulse (5,40,3): | 29.1670 | |
| ROCnROLL: | 1 | |
| TRIX (15,9): | 0.6150 | |
| Courbe Coppock: | 110.30 |
| MA7: | 0.385 | |
| MA20: | 0.300 | |
| MA50: | 0.268 | |
| MA100: | 0.506 | |
| MAexp7: | 0.442 | |
| MAexp20: | 0.339 | |
| MAexp50: | 0.347 | |
| MAexp100: | 0.495 | |
| Price / MA7: | +49.87% | |
| Price / MA20: | +92.33% | |
| Price / MA50: | +115.30% | |
| Price / MA100: | +14.03% | |
| Price / MAexp7: | +30.54% | |
| Price / MAexp20: | +70.21% | |
| Price / MAexp50: | +66.28% | |
| Price / MAexp100: | +16.57% |
News
The last news published on DENBURY RESOURCES INC. at the time of the generation of this analysis was as follows:
-
 Denbury Resources Inc. - DNR Stock Chart Technical Analysis for 06-08-2020
- Thinking about buying stock in TOP Ships, Gilead Sciences, Seanergy Maritime, Denbury Resources, or Noble Corp?
-
Denbury Resources Inc. - DNR Stock Chart Technical Analysis for 06-01-2020
-
Denbury Resources Inc. - DNR Stock Chart Technical Analysis for 05-18-2020
- ATTENTION DENBURY RESOURCES EMPLOYEES/INVESTORS: KlaymanToskes Commences Investigation into Damages Sustained During Coronavirus Pandemic in Denbury Resources Stock with Full-Service Brokerage Firms
About author

Online


Add a comment
Comments
0 comments on the analysis DENBURY RESOURCES INC. - Daily