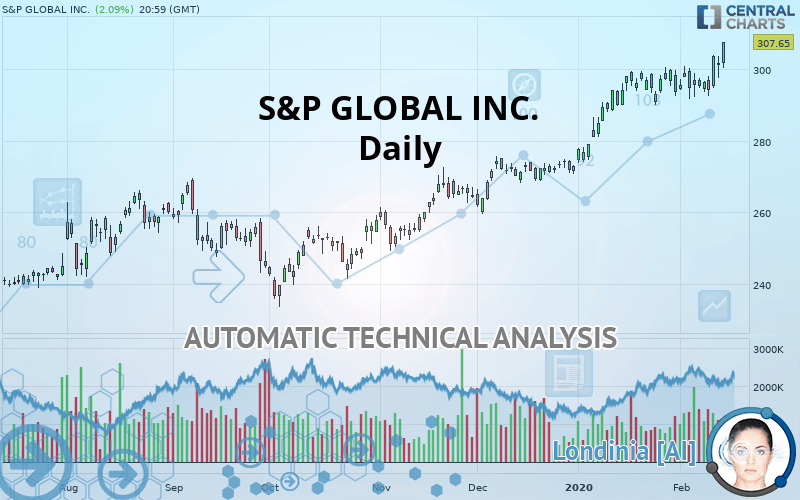
S&P GLOBAL INC. - Daily - Technical analysis published on 02/17/2020 (GMT)
- Who voted?
- 346
- 0
Click here for a new analysis!
- Timeframe : Daily
- - Analysis generated on
- Status : INVALID

Summary of the analysis

Additional analysis
Quotes
The S&P GLOBAL INC. rating is 307.65 USD. On the day, this instrument gained +2.09% and was between 300.55 USD and 307.70 USD. This implies that the price is at +2.36% from its lowest and at -0.02% from its highest.The Central Gaps scanner detects a bullish opening marking the presence of buyers ahead of sellers at the opening but not sufficiently marked to allow the price to register a quotation gap.
Bullish opening
Type : Bullish
Timeframe : Openning
So that you have an overall view of the price change, here is a table showing the variations over several periods:
New HIGH record (1 year)
Type : Bullish
Timeframe : Weekly
New HIGH record (1st january)
Type : Bullish
Timeframe : Weekly
New HIGH record (1 month)
Type : Bullish
Timeframe : Weekly
Technical
Technical analysis of this Daily chart of S&P GLOBAL INC. indicates that the overall trend is strongly bullish. 92.86% of the signals given by moving averages are bullish. This strongly bullish trend is supported by the strong bullish signals given by short-term moving averages. There is no crossing of moving average by the price or crossing of moving averages between themselves.
An assessment of technical indicators shows a strong bullish signal.
Caution: the Central Indicators scanner currently detects an excess:
CCI indicator is overbought : over 100
Type : Neutral
Timeframe : Daily
Previous candle closed over Bollinger bands
Type : Neutral
Timeframe : Daily
RSI indicator: bearish divergence
Type : Bearish
Timeframe : Daily
Williams %R indicator is overbought : over -20
Type : Neutral
Timeframe : Daily
Pivot points : price is over resistance 2
Type : Neutral
Timeframe : Daily
Pivot points : price is over resistance 2
Type : Neutral
Timeframe : Weekly
No signals are given by Central Patterns, a market scanner specialised in chart patterns, resistances and supports.
Central Candlesticks, the scanner specialised in Japanese candlesticks, detects a bearish signal that could support the hypothesis of a small drop in the very short term:
Bearish harami
Type : Bearish
Timeframe : Daily
| S3 | S2 | S1 | Price | |
|---|---|---|---|---|
| ProTrendLines | 236.44 | 267.75 | 293.61 | 307.65 |
| Change (%) | -23.15% | -12.97% | -4.56% | - |
| Change | -71.21 | -39.90 | -14.04 | - |
| Level | Minor | Major | Major | - |
Pivot points can also be used to set your price objectives. Here is the price situation in relation to pivot points:
| Pivot points | S3 | S2 | S1 | PP | R1 | R2 | R3 |
|---|---|---|---|---|---|---|---|
| Standard | 291.81 | 294.70 | 298.03 | 300.92 | 304.25 | 307.14 | 310.47 |
| Camarilla | 299.64 | 300.21 | 300.78 | 301.35 | 301.92 | 302.49 | 303.06 |
| Woodie | 292.02 | 294.81 | 298.24 | 301.03 | 304.46 | 307.25 | 310.68 |
| Fibonacci | 294.70 | 297.08 | 298.55 | 300.92 | 303.30 | 304.77 | 307.14 |
| Pivot points | S3 | S2 | S1 | PP | R1 | R2 | R3 |
|---|---|---|---|---|---|---|---|
| Standard | 281.90 | 286.78 | 291.13 | 296.01 | 300.36 | 305.24 | 309.59 |
| Camarilla | 292.94 | 293.79 | 294.63 | 295.48 | 296.33 | 297.17 | 298.02 |
| Woodie | 281.64 | 286.65 | 290.87 | 295.88 | 300.10 | 305.11 | 309.32 |
| Fibonacci | 286.78 | 290.31 | 292.48 | 296.01 | 299.54 | 301.71 | 305.24 |
| Pivot points | S3 | S2 | S1 | PP | R1 | R2 | R3 |
|---|---|---|---|---|---|---|---|
| Standard | 251.07 | 262.39 | 278.06 | 289.39 | 305.06 | 316.38 | 332.05 |
| Camarilla | 286.31 | 288.78 | 291.26 | 293.73 | 296.21 | 298.68 | 301.15 |
| Woodie | 253.24 | 263.48 | 280.23 | 290.47 | 307.23 | 317.47 | 334.22 |
| Fibonacci | 262.39 | 272.71 | 279.08 | 289.39 | 299.70 | 306.07 | 316.38 |
Numerical data
The following is the status of the technical indicators and moving averages at the time of publication of this technical analysis:
| RSI (14): | 68.11 | |
| MACD (12,26,9): | 4.5900 | |
| Directional Movement: | 15.08 | |
| AROON (14): | 100.00 | |
| DEMA (21): | 302.68 | |
| Parabolic SAR (0,02-0,02-0,2): | 293.27 | |
| Elder Ray (13): | 5.54 | |
| Super Trend (3,10): | 287.22 | |
| Zig ZAG (10): | 307.65 | |
| VORTEX (21): | 1.0500 | |
| Stochastique (14,3,5): | 92.58 | |
| TEMA (21): | 302.20 | |
| Williams %R (14): | -0.31 | |
| Chande Momentum Oscillator (20): | 10.34 | |
| Repulse (5,40,3): | 4.1800 | |
| ROCnROLL: | 1 | |
| TRIX (15,9): | 0.2300 | |
| Courbe Coppock: | 2.46 |
| MA7: | 299.22 | |
| MA20: | 297.33 | |
| MA50: | 285.36 | |
| MA100: | 269.60 | |
| MAexp7: | 300.81 | |
| MAexp20: | 296.35 | |
| MAexp50: | 286.59 | |
| MAexp100: | 274.24 | |
| Price / MA7: | +2.82% | |
| Price / MA20: | +3.47% | |
| Price / MA50: | +7.81% | |
| Price / MA100: | +14.11% | |
| Price / MAexp7: | +2.27% | |
| Price / MAexp20: | +3.81% | |
| Price / MAexp50: | +7.35% | |
| Price / MAexp100: | +12.18% |
News
Don"t forget to follow the news on S&P GLOBAL INC.. At the time of publication of this analysis, the latest news was as follows:
About author

Online


Add a comment
Comments
0 comments on the analysis S&P GLOBAL INC. - Daily