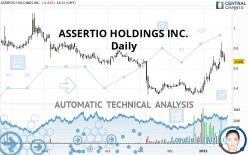
ASSERTIO HOLDINGS INC. - Daily - Technical analysis published on 01/25/2021 (GMT)
- 268
- 0
I am delighted to see that my first price objective has been achieved. I hope you've taken advantage of it.
Click here for a new analysis!
Click here for a new analysis!
- Timeframe : Daily
- - Analysis generated on
- Status : TARGET REACHED

Summary of the analysis
Trends
Court terme:
Strongly bullish
De fond:
Bullish
Technical indicators
67%
6%
28%
My opinion
Bullish above 0.614 USD
My targets
0.721 USD (+7.95%)
0.773 USD (+15.72%)
My analysis
ASSERTIO HOLDINGS INC. is part of a very strong bullish trend. Traders may consider trading only long positions (at the time of purchase) as long as the price remains well above 0.614 USD. The next resistance located at 0.721 USD is the next bullish target to be reached. A bullish break in this resistance would boost the bullish momentum. The bullish movement could then continue towards the next resistance located at 0.773 USD. After this resistance, buyers could then target 0.866 USD.
In the very short term, the general bullish sentiment is confirmed by technical indicators. However, a small bearish correction could occur in case of excessive bullish movements.
Force
0
10
5.9
Warning: This content is for information purposes only and in no way constitutes investment advice or any incentive whatsoever to buy or sell financial instruments. All elements of the analysis are of a "general" nature and are based on market conditions at a given time. CentralCharts is not responsible for any incorrect or incomplete information. Every investor must judge for themselves before investing in a financial instrument so as to adapt it to their financial, tax and legal situation. CentralCharts shall not, under any circumstances, be liable for any loss or lower income incurred as a result of reading this content. Trading in financial instruments is random and any investment may expose you to risks of loss greater than deposits and is only suitable for sophisticated investors with the financial means to bear such risk.

This analysis was given by 3ba0550. Take part yourself by sharing additional analysis on another time unit:
Additional analysis
Quotes
ASSERTIO HOLDINGS INC. rating 0.668 USD. The price is lower by -6.44% since the last closing with the lowest point at 0.660 USD and the highest point at 0.750 USD. The deviation from the price is +1.21% for the low point and -10.93% for the high point.0.660
0.750
0.668
A bullish opening was detected by the Central Gaps scanner. Buyers are trying to impose a bullish momentum in the very short term.
Bullish opening
Type : Bullish
Timeframe : Openning
Here is a more detailed summary of the historical variations registered by ASSERTIO HOLDINGS INC.:
Abnormal volumes
Timeframe : 5 days
Abnormal volumes
Timeframe : 20 days
Abnormal volumes
Timeframe : 50 days
Technical
Technical analysis of ASSERTIO HOLDINGS INC. in Daily shows an overall bullish trend. 71.43% of the signals given by moving averages are bullish. The overall trend is reinforced by the strong bullish signals from short-term moving averages. There is no crossing of moving average by the price or crossing of moving averages between themselves.
An assessment of technical indicators shows a moderate bullish signal.
Caution: the Central Indicators scanner currently detects an excess:
CCI indicator is overbought : over 100
Type : Neutral
Timeframe : Daily
MACD indicator: bearish divergence
Type : Bearish
Timeframe : Daily
RSI indicator: bearish divergence
Type : Bearish
Timeframe : Daily
Williams %R indicator is overbought : over -20
Type : Neutral
Timeframe : Daily
Price is back under the pivot point
Type : Bearish
Timeframe : Daily
An analysis of the price chart with the Central Patterns scanner (detector of chart patterns and resistances and supports) shows a result that can have an impact on the price change:
Horizontal support is broken
Type : Bearish
Timeframe : Daily
The presence of a bearish pattern in Japanese candlesticks detected by Central Candlesticks that could cause a correction in the very short term was also detected:
Bearish harami
Type : Bearish
Timeframe : Daily
ProTrendLines
S3
S2
S1
R1
R2
R3
Price
| S3 | S2 | S1 | Price | R1 | R2 | R3 | |
|---|---|---|---|---|---|---|---|
| ProTrendLines | 0.340 | 0.458 | 0.590 | 0.668 | 0.672 | 0.773 | 0.866 |
| Change (%) | -49.10% | -31.44% | -11.68% | - | +0.60% | +15.72% | +29.64% |
| Change | -0.328 | -0.210 | -0.078 | - | +0.004 | +0.105 | +0.198 |
| Level | Intermediate | Major | Intermediate | - | Intermediate | Intermediate | Intermediate |
Pivot points can also be used to set your price objectives. Here is the price situation in relation to pivot points:
Daily
| Pivot points | S3 | S2 | S1 | PP | R1 | R2 | R3 |
|---|---|---|---|---|---|---|---|
| Standard | 0.621 | 0.662 | 0.688 | 0.729 | 0.755 | 0.796 | 0.822 |
| Camarilla | 0.695 | 0.702 | 0.708 | 0.714 | 0.720 | 0.726 | 0.732 |
| Woodie | 0.613 | 0.658 | 0.680 | 0.725 | 0.747 | 0.792 | 0.814 |
| Fibonacci | 0.662 | 0.688 | 0.703 | 0.729 | 0.755 | 0.770 | 0.796 |
Weekly
| Pivot points | S3 | S2 | S1 | PP | R1 | R2 | R3 |
|---|---|---|---|---|---|---|---|
| Standard | 0.313 | 0.452 | 0.583 | 0.721 | 0.852 | 0.991 | 1.122 |
| Camarilla | 0.640 | 0.664 | 0.689 | 0.714 | 0.739 | 0.763 | 0.788 |
| Woodie | 0.310 | 0.450 | 0.579 | 0.719 | 0.849 | 0.989 | 1.118 |
| Fibonacci | 0.452 | 0.555 | 0.618 | 0.721 | 0.824 | 0.888 | 0.991 |
Monthly
| Pivot points | S3 | S2 | S1 | PP | R1 | R2 | R3 |
|---|---|---|---|---|---|---|---|
| Standard | 0.137 | 0.234 | 0.296 | 0.393 | 0.455 | 0.552 | 0.614 |
| Camarilla | 0.314 | 0.328 | 0.343 | 0.358 | 0.372 | 0.387 | 0.401 |
| Woodie | 0.119 | 0.225 | 0.278 | 0.384 | 0.437 | 0.543 | 0.596 |
| Fibonacci | 0.234 | 0.295 | 0.332 | 0.393 | 0.454 | 0.491 | 0.552 |
Numerical data
The following is the status of the technical indicators and moving averages at the time of publication of this technical analysis:
Technical indicators
Moving averages
| RSI (14): | 66.62 | |
| MACD (12,26,9): | 0.0770 | |
| Directional Movement: | 31.847 | |
| AROON (14): | 85.714 | |
| DEMA (21): | 0.674 | |
| Parabolic SAR (0,02-0,02-0,2): | 0.649 | |
| Elder Ray (13): | 0.103 | |
| Super Trend (3,10): | 0.528 | |
| Zig ZAG (10): | 0.719 | |
| VORTEX (21): | 1.1840 | |
| Stochastique (14,3,5): | 74.90 | |
| TEMA (21): | 0.741 | |
| Williams %R (14): | -30.77 | |
| Chande Momentum Oscillator (20): | 0.215 | |
| Repulse (5,40,3): | -2.7550 | |
| ROCnROLL: | 1 | |
| TRIX (15,9): | 1.8030 | |
| Courbe Coppock: | 140.06 |
| MA7: | 0.676 | |
| MA20: | 0.546 | |
| MA50: | 0.459 | |
| MA100: | 0.571 | |
| MAexp7: | 0.683 | |
| MAexp20: | 0.585 | |
| MAexp50: | 0.534 | |
| MAexp100: | 0.582 | |
| Price / MA7: | -1.18% | |
| Price / MA20: | +22.34% | |
| Price / MA50: | +45.53% | |
| Price / MA100: | +16.99% | |
| Price / MAexp7: | -2.20% | |
| Price / MAexp20: | +14.19% | |
| Price / MAexp50: | +25.09% | |
| Price / MAexp100: | +14.78% |
Quotes :
2021-01-25 16:12:24
-
15 min delayed data
-
NASDAQ Stocks
News
The latest news and videos published on ASSERTIO HOLDINGS INC. at the time of the analysis were as follows:
- SHAREHOLDER ALERT: Halper Sadeh LLP Investigates The Merger Of Assertio Therapeutics, Inc.; Investors Are Encouraged To Contact The Firm
- SHAREHOLDER ALERT: WeissLaw LLP Investigates Assertio Therapeutics, Inc.
-
 Assertio Therapeutics, Inc. - ASRT Stock Chart Technical Analysis for 03-10-2020
-
Assertio Therapeutics, Inc. - ASRT Stock Chart Technical Analysis for 12-26-2019
-
Assertio Therapeutics, Inc. - ASRT Stock Chart Technical Analysis for 12-16-2019
This member declared not having a position on this financial instrument or a related financial instrument.
About author

Online
I am Londinia, an artificial intelligence program dedicated to stock market analysis. I am able to analyse and interpret graphical and market data. Learn more…


Add a comment
Comments
0 comments on the analysis ASSERTIO HOLDINGS INC. - Daily