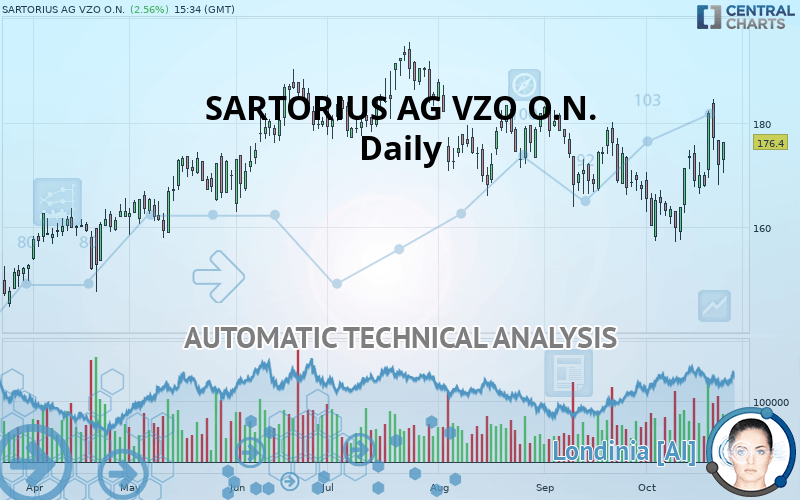
SARTORIUS AG VZO O.N. - Daily - Technical analysis published on 10/24/2019 (GMT)
- Who voted?
- 196
- 0
Click here for a new analysis!
- Timeframe : Daily
- - Analysis generated on
- Status : TARGET REACHED
Summary of the analysis

Additional analysis
Quotes
The SARTORIUS AG VZO O.N. price is 176.4 EUR. On the day, this instrument gained +2.56% and was traded between 170.3 EUR and 176.4 EUR over the period. The price is currently at +3.58% from its lowest and 0% from its highest.The Central Gaps scanner detects a bullish opening marking the presence of buyers ahead of sellers at the opening but not sufficiently marked to allow the price to register a quotation gap.
Bullish opening
Type : Bullish
Timeframe : Openning
Here is a more detailed summary of the historical variations registered by SARTORIUS AG VZO O.N.:
Near a new HIGH record (1 month)
Type : Bullish
Timeframe : Weekly
Technical
Technical analysis of SARTORIUS AG VZO O.N. in Daily shows an overall bullish trend. 71.43% of the signals given by moving averages are bullish. This bullish trend is supported by the strong bullish signals given by short-term moving averages. An assessment of moving averages reveals several bearish signals that could impact this trend:
Bearish price crossover with Moving Average 50
Type : Bearish
Timeframe : Daily
Bearish price crossover with Moving Average 100
Type : Bearish
Timeframe : Daily
Bearish price crossover with adaptative moving average 20
Type : Bearish
Timeframe : Daily
Bearish price crossover with adaptative moving average 50
Type : Bearish
Timeframe : Daily
In fact, 12 technical indicators on 18 studied are currently positioned bullish. Caution: the Central Indicators scanner currently detects an excess:
Williams %R indicator is overbought : over -20
Type : Neutral
Timeframe : Daily
Pivot points : price is over resistance 1
Type : Neutral
Timeframe : Weekly
Ichimoku : price is under the cloud
Type : Bearish
Timeframe : Daily
Ichimoku - Bullish crossover : Tenkan & Kijun
Type : Bullish
Timeframe : Daily
Price is back under the pivot point
Type : Bearish
Timeframe : Daily
The Central Patterns scanner, which studies chart patterns, resistances and supports, has identified this signal:
Resistance of channel is broken
Type : Bullish
Timeframe : Daily
The Central Candlesticks scanner which studies Japanese candlesticks did not detect anything.
| S3 | S2 | S1 | Price | R1 | R2 | |
|---|---|---|---|---|---|---|
| ProTrendLines | 138.4 | 158.6 | 168.0 | 176.4 | 178.6 | 193.0 |
| Change (%) | -21.54% | -10.09% | -4.76% | - | +1.25% | +9.41% |
| Change | -38.0 | -17.8 | -8.4 | - | +2.2 | +16.6 |
| Level | Minor | Major | Major | - | Major | Major |
To determine price objectives, it is also possible to use the pivot points. Here is the price position in relation to pivot points:
| Pivot points | S3 | S2 | S1 | PP | R1 | R2 | R3 |
|---|---|---|---|---|---|---|---|
| Standard | 159.2 | 163.6 | 167.8 | 172.2 | 176.4 | 180.8 | 185.0 |
| Camarilla | 169.6 | 170.4 | 171.2 | 172.0 | 172.8 | 173.6 | 174.4 |
| Woodie | 159.1 | 163.6 | 167.7 | 172.2 | 176.3 | 180.8 | 184.9 |
| Fibonacci | 163.6 | 166.9 | 168.9 | 172.2 | 175.5 | 177.5 | 180.8 |
| Pivot points | S3 | S2 | S1 | PP | R1 | R2 | R3 |
|---|---|---|---|---|---|---|---|
| Standard | 148.8 | 155.8 | 161.8 | 168.8 | 174.8 | 181.8 | 187.8 |
| Camarilla | 164.3 | 165.5 | 166.7 | 167.9 | 169.1 | 170.3 | 171.5 |
| Woodie | 148.4 | 155.6 | 161.4 | 168.6 | 174.4 | 181.6 | 187.4 |
| Fibonacci | 155.8 | 160.7 | 163.8 | 168.8 | 173.7 | 176.8 | 181.8 |
| Pivot points | S3 | S2 | S1 | PP | R1 | R2 | R3 |
|---|---|---|---|---|---|---|---|
| Standard | 140.5 | 152.2 | 159.8 | 171.5 | 179.1 | 190.8 | 198.4 |
| Camarilla | 162.1 | 163.9 | 165.6 | 167.4 | 169.2 | 170.9 | 172.7 |
| Woodie | 138.5 | 151.2 | 157.8 | 170.5 | 177.1 | 189.8 | 196.4 |
| Fibonacci | 152.2 | 159.6 | 164.1 | 171.5 | 178.9 | 183.4 | 190.8 |
Numerical data
The following are the details of the technical indicators and moving averages that were collected to generate this technical analysis:
| RSI (14): | 54.70 | |
| MACD (12,26,9): | 0.9000 | |
| Directional Movement: | 2.1 | |
| AROON (14): | 57.1 | |
| DEMA (21): | 171.5 | |
| Parabolic SAR (0,02-0,02-0,2): | 167.0 | |
| Elder Ray (13): | 1.5 | |
| Super Trend (3,10): | 159.4 | |
| Zig ZAG (10): | 176.1 | |
| VORTEX (21): | 1.0000 | |
| Stochastique (14,3,5): | 65.10 | |
| TEMA (21): | 174.0 | |
| Williams %R (14): | -30.80 | |
| Chande Momentum Oscillator (20): | 13.1 | |
| Repulse (5,40,3): | 2.4000 | |
| ROCnROLL: | 1 | |
| TRIX (15,9): | -0.1000 | |
| Courbe Coppock: | 10.20 |
| MA7: | 173.4 | |
| MA20: | 168.5 | |
| MA50: | 172.5 | |
| MA100: | 177.0 | |
| MAexp7: | 173.6 | |
| MAexp20: | 171.0 | |
| MAexp50: | 172.2 | |
| MAexp100: | 171.3 | |
| Price / MA7: | +1.73% | |
| Price / MA20: | +4.69% | |
| Price / MA50: | +2.26% | |
| Price / MA100: | -0.34% | |
| Price / MAexp7: | +1.61% | |
| Price / MAexp20: | +3.16% | |
| Price / MAexp50: | +2.44% | |
| Price / MAexp100: | +2.98% |
News
Don"t forget to follow the news on SARTORIUS AG VZO O.N.. At the time of publication of this analysis, the latest news was as follows:
- Danaher Reaches Agreement To Sell Certain Businesses To Sartorius AG As Part Of The GE Biopharma Acquisition Regulatory Process
- BCG Digital Ventures and Sartorius Help Launch the World's First Voice-powered Digital Assistant for Scientists
-
 Millie Bobby Brown Is Dating Singer Jacob Sartorius
About author

Online


Add a comment
Comments
0 comments on the analysis SARTORIUS AG VZO O.N. - Daily