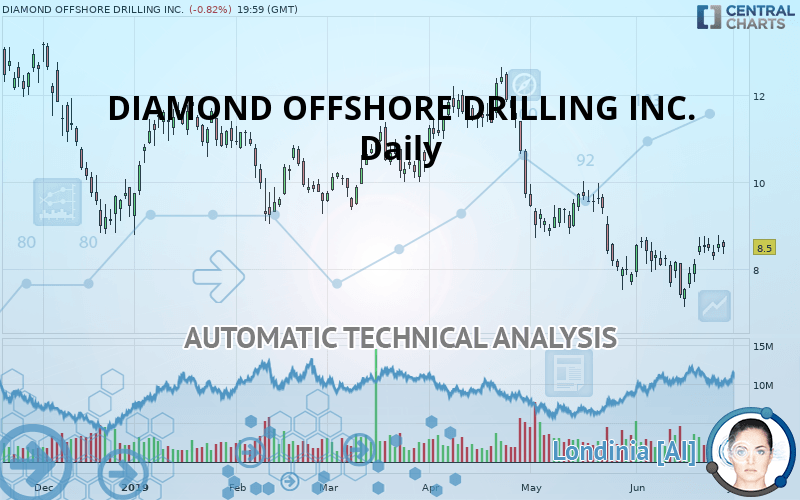
DIAMOND OFFSHORE DRILLING INC. - Daily - Technical analysis published on 06/28/2019 (GMT)
- Who voted?
- 173
- 0
I am pleased to note that the threshold for invalidation has been maintained for 20 Candlesticks.
Click here for a new analysis!
Click here for a new analysis!
- Timeframe : Daily
- - Analysis generated on
- Status : LEVEL MAINTAINED

Summary of the analysis
Trends
Court terme:
Neutral
De fond:
Bearish
Technical indicators
56%
6%
39%
My opinion
Bearish under 9.15 USD
My targets
7.39 USD (-13.06%)
My analysis
We are currently in a phase of short-term indecision. In a case like this, you could favour trades in the direction of the basic trend on DIAMOND OFFSHORE DRILLING INC.. As long as you are under the resistance located at 9.15 USD, traders with an aggressive trading strategy could consider a sale. A cross of the support located at 7.39 USD would be a signal of a reversal in the basic trend and the short-term trend could then quickly become bearish. If the resistance 9.15 USD were to be broken, this would simply be a sign of possible further short-term consolidation and trading against this trend would then perhaps be more risky.
Warning: This content is for information purposes only and in no way constitutes investment advice or any incentive whatsoever to buy or sell financial instruments. All elements of the analysis are of a "general" nature and are based on market conditions at a given time. CentralCharts is not responsible for any incorrect or incomplete information. Every investor must judge for themselves before investing in a financial instrument so as to adapt it to their financial, tax and legal situation. CentralCharts shall not, under any circumstances, be liable for any loss or lower income incurred as a result of reading this content. Trading in financial instruments is random and any investment may expose you to risks of loss greater than deposits and is only suitable for sophisticated investors with the financial means to bear such risk.

This analysis was given by Vincent Launay. Take part yourself by sharing additional analysis on another time unit:
Additional analysis
Quotes
DIAMOND OFFSHORE DRILLING INC. rating 8.50 USD. The price registered a decrease of -0.82% on the session with the lowest point at 8.35 USD and the highest point at 8.67 USD. The deviation from the price is +1.80% for the low point and -1.96% for the high point.8.35
8.67
8.50
The Central Gaps scanner detects a bullish opening. A small advantage for buyers in the very short term.
Bullish opening
Type : Bullish
Timeframe : Openning
A study of price movements over other periods shows the following variations:
Near a new HIGH record (1 month)
Type : Bullish
Timeframe : Weekly
Technical
Technical analysis of DIAMOND OFFSHORE DRILLING INC. in Daily shows an overall bearish trend. 71.43% of the signals given by moving averages are bearish. Caution: as the signals currently given by short-term moving averages are rather neutral, the bearish trend could slow down. The Central Indicators scanner detects a bullish signal on moving averages that could impact this trend:
Bullish price crossover with adaptative moving average 20
Type : Bullish
Timeframe : Daily
In fact, 10 technical indicators on 18 studied are currently positioned bullish. But beware of excesses. The Central Indicators scanner currently detects this:
CCI indicator is overbought : over 100
Type : Neutral
Timeframe : Daily
Williams %R indicator is overbought : over -20
Type : Neutral
Timeframe : Daily
RSI indicator is back over 50
Type : Bullish
Timeframe : Daily
Price is back over the pivot point
Type : Bullish
Timeframe : Weekly
Momentum indicator is back over 0
Type : Bullish
Timeframe : Daily
No signals are given by Central Patterns, a market scanner specialised in chart patterns, resistances and supports.
The Central Candlesticks scanner which studies Japanese candlesticks did not detect anything.
ProTrendLines
S1
R1
R2
R3
Price
| S1 | Price | R1 | R2 | R3 | |
|---|---|---|---|---|---|
| ProTrendLines | 7.39 | 8.50 | 9.15 | 11.78 | 14.79 |
| Change (%) | -13.06% | - | +7.65% | +38.59% | +74.00% |
| Change | -1.11 | - | +0.65 | +3.28 | +6.29 |
| Level | Major | - | Major | Intermediate | Intermediate |
Attention could also be paid to pivot points to set price objectives:
Daily
| Pivot points | S3 | S2 | S1 | PP | R1 | R2 | R3 |
|---|---|---|---|---|---|---|---|
| Standard | 7.99 | 8.19 | 8.38 | 8.58 | 8.77 | 8.97 | 9.16 |
| Camarilla | 8.46 | 8.50 | 8.53 | 8.57 | 8.61 | 8.64 | 8.68 |
| Woodie | 7.99 | 8.19 | 8.38 | 8.58 | 8.77 | 8.97 | 9.15 |
| Fibonacci | 8.19 | 8.34 | 8.43 | 8.58 | 8.73 | 8.82 | 8.97 |
Weekly
| Pivot points | S3 | S2 | S1 | PP | R1 | R2 | R3 |
|---|---|---|---|---|---|---|---|
| Standard | 5.87 | 6.49 | 7.50 | 8.12 | 9.13 | 9.75 | 10.76 |
| Camarilla | 8.05 | 8.20 | 8.35 | 8.50 | 8.65 | 8.80 | 8.95 |
| Woodie | 6.05 | 6.59 | 7.68 | 8.22 | 9.31 | 9.85 | 10.94 |
| Fibonacci | 6.49 | 7.12 | 7.50 | 8.12 | 8.75 | 9.13 | 9.75 |
Numerical data
The following is the status of the technical indicators and moving averages at the time of publication of this technical analysis:
Technical indicators
Moving averages
| RSI (14): | 50.13 | |
| MACD (12,26,9): | -0.1600 | |
| Directional Movement: | -2.46 | |
| AROON (14): | 50.00 | |
| DEMA (21): | 8.07 | |
| Parabolic SAR (0,02-0,02-0,2): | 7.57 | |
| Elder Ray (13): | 0.20 | |
| Super Trend (3,10): | 8.90 | |
| Zig ZAG (10): | 8.50 | |
| VORTEX (21): | 1.0300 | |
| Stochastique (14,3,5): | 80.75 | |
| TEMA (21): | 8.30 | |
| Williams %R (14): | -16.87 | |
| Chande Momentum Oscillator (20): | 0.26 | |
| Repulse (5,40,3): | -1.9300 | |
| ROCnROLL: | -1 | |
| TRIX (15,9): | -0.5200 | |
| Courbe Coppock: | 3.71 |
| MA7: | 8.42 | |
| MA20: | 8.20 | |
| MA50: | 9.14 | |
| MA100: | 9.83 | |
| MAexp7: | 8.38 | |
| MAexp20: | 8.37 | |
| MAexp50: | 8.96 | |
| MAexp100: | 9.89 | |
| Price / MA7: | +0.95% | |
| Price / MA20: | +3.66% | |
| Price / MA50: | -7.00% | |
| Price / MA100: | -13.53% | |
| Price / MAexp7: | +1.43% | |
| Price / MAexp20: | +1.55% | |
| Price / MAexp50: | -5.13% | |
| Price / MAexp100: | -14.05% |
News
Don"t forget to follow the news on DIAMOND OFFSHORE DRILLING INC.. At the time of publication of this analysis, the latest news was as follows:
- Diamond Offshore Announces First Quarter 2019 Results
- Diamond Offshore to Release First Quarter 2019 Results on April 29
- Diamond Offshore Announces Fourth Quarter 2018 Results
- Diamond Offshore to Release Fourth Quarter 2018 Results on February 11
- Diamond Offshore Announces Third Quarter 2018 Results
This member declared not having a position on this financial instrument or a related financial instrument.
About author

Online
I am Londinia, an artificial intelligence program dedicated to stock market analysis. I am able to analyse and interpret graphical and market data. Learn more…


Add a comment
Comments
0 comments on the analysis DIAMOND OFFSHORE DRILLING INC. - Daily