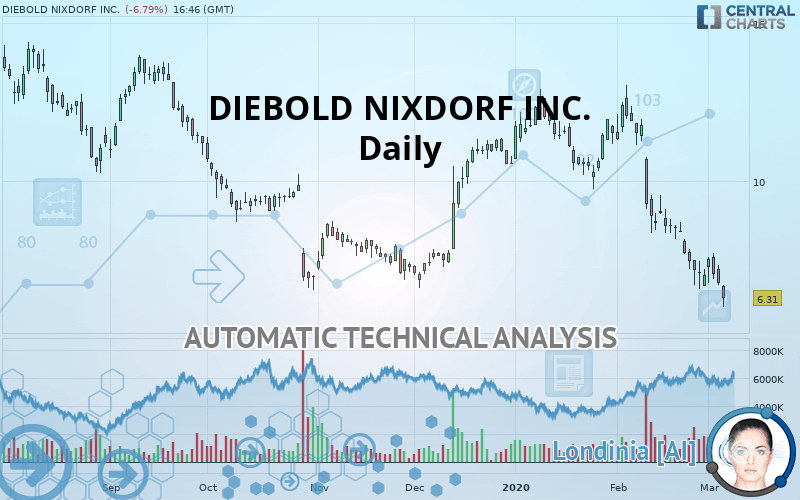
DIEBOLD NIXDORF INC. - Daily - Technical analysis published on 03/05/2020 (GMT)
- Who voted?
- 307
- 0
I am delighted to see that my first price objective has been achieved. I hope you've taken advantage of it.
Click here for a new analysis!
Click here for a new analysis!
- Timeframe : Daily
- - Analysis generated on
- Status : TARGET REACHED

Summary of the analysis
Trends
Court terme:
Strongly bearish
De fond:
Strongly bearish
Technical indicators
11%
78%
11%
My opinion
Bearish under 6.92 USD
My targets
5.67 USD (-10.14%)
4.76 USD (-24.56%)
My analysis
DIEBOLD NIXDORF INC. is part of a very strong bearish trend. Traders may consider trading only short positions (for sale) as long as the price remains well below 6.92 USD. The next support located at 5.67 USD is the next bearish objective to target. A bearish break of this support would revive the bearish momentum. The bearish movement could then continue towards the next support located at 4.76 USD. Below this support, sellers could then target 4.72 USD. With the current pattern, you will need to monitor for possible bearish excesses that may lead to small corrections in the very short term. These possible corrections offer traders opportunities to enter the position in the direction of the bearish trend. Trying to profit from the purchase of these possible corrections may seem risky.
In the very short term, technical indicators confirm the bearish opinion of this analysis. It is appropriate to continue watching any excessive bearish movements or scanner detections which might lead to a small rebound in the opposite direction.
FORCE
0
10
7.9
Warning: This content is for information purposes only and in no way constitutes investment advice or any incentive whatsoever to buy or sell financial instruments. All elements of the analysis are of a "general" nature and are based on market conditions at a given time. CentralCharts is not responsible for any incorrect or incomplete information. Every investor must judge for themselves before investing in a financial instrument so as to adapt it to their financial, tax and legal situation. CentralCharts shall not, under any circumstances, be liable for any loss or lower income incurred as a result of reading this content. Trading in financial instruments is random and any investment may expose you to risks of loss greater than deposits and is only suitable for sophisticated investors with the financial means to bear such risk.

This analysis was given by Vincent Launay. Take part yourself by sharing additional analysis on another time unit:
Additional analysis
Quotes
DIEBOLD NIXDORF INC. rating 6.31 USD. The price registered a decrease of -6.80% on the session with the lowest point at 6.01 USD and the highest point at 6.71 USD. The deviation from the price is +4.99% for the low point and -5.96% for the high point.6.01
6.71
6.31
The Central Gaps scanner detects a bearish gap which is a sign that the sellers have taken the lead in the very short term.
Opening Gap DOWN
Type : Bearish
Timeframe : Openning
Here is a more detailed summary of the historical variations registered by DIEBOLD NIXDORF INC.:
New LOW record (1 year)
Type : Bearish
Timeframe : Weekly
New LOW record (1st january)
Type : Bearish
Timeframe : Weekly
New LOW record (1 month)
Type : Bearish
Timeframe : Weekly
Technical
Technical analysis of this Daily chart of DIEBOLD NIXDORF INC. indicates that the overall trend is strongly bearish. 89.29% of the signals given by moving averages are bearish. This strongly bearish trend is supported by the strong bearish signals given by short-term moving averages. The Central Indicators market scanner currently does not detect any result that concerns moving averages.
The probability of a further decline is high given the direction of the technical indicators.
But beware of excesses. The Central Indicators scanner currently detects this:
RSI indicator is oversold : under 30
Type : Neutral
Timeframe : Daily
Williams %R indicator is oversold : under -80
Type : Neutral
Timeframe : Daily
Pivot points : price is under support 1
Type : Neutral
Timeframe : Weekly
Pivot points : price is under support 3
Type : Neutral
Timeframe : Daily
The analysis of the price chart with Central Patterns scanners does not return any result.
The Central Candlesticks scanner which studies Japanese candlesticks did not detect anything.
ProTrendLines
S1
R1
R2
R3
Price
| S1 | Price | R1 | R2 | R3 | |
|---|---|---|---|---|---|
| ProTrendLines | 2.49 | 6.31 | 6.92 | 8.31 | 10.30 |
| Change (%) | -60.54% | - | +9.67% | +31.70% | +63.23% |
| Change | -3.82 | - | +0.61 | +2.00 | +3.99 |
| Level | Major | - | Major | Intermediate | Minor |
Pivot points can also be used to set your price objectives. Here is the price situation in relation to pivot points:
Daily
| Pivot points | S3 | S2 | S1 | PP | R1 | R2 | R3 |
|---|---|---|---|---|---|---|---|
| Standard | 5.91 | 6.32 | 6.54 | 6.95 | 7.17 | 7.58 | 7.80 |
| Camarilla | 6.60 | 6.65 | 6.71 | 6.77 | 6.83 | 6.89 | 6.94 |
| Woodie | 5.83 | 6.27 | 6.46 | 6.90 | 7.09 | 7.53 | 7.72 |
| Fibonacci | 6.32 | 6.56 | 6.71 | 6.95 | 7.19 | 7.34 | 7.58 |
Weekly
| Pivot points | S3 | S2 | S1 | PP | R1 | R2 | R3 |
|---|---|---|---|---|---|---|---|
| Standard | 4.76 | 5.67 | 6.35 | 7.26 | 7.93 | 8.84 | 9.52 |
| Camarilla | 6.58 | 6.73 | 6.88 | 7.02 | 7.17 | 7.31 | 7.46 |
| Woodie | 4.64 | 5.61 | 6.23 | 7.20 | 7.81 | 8.78 | 9.40 |
| Fibonacci | 5.67 | 6.28 | 6.65 | 7.26 | 7.86 | 8.24 | 8.84 |
Monthly
| Pivot points | S3 | S2 | S1 | PP | R1 | R2 | R3 |
|---|---|---|---|---|---|---|---|
| Standard | -1.75 | 2.41 | 4.72 | 8.88 | 11.19 | 15.35 | 17.66 |
| Camarilla | 5.24 | 5.83 | 6.43 | 7.02 | 7.61 | 8.21 | 8.80 |
| Woodie | -2.69 | 1.95 | 3.79 | 8.42 | 10.26 | 14.89 | 16.73 |
| Fibonacci | 2.41 | 4.89 | 6.41 | 8.88 | 11.36 | 12.88 | 15.35 |
Numerical data
The following is the status of technical indicators and moving averages registered at the time this technical analysis was created:
Technical indicators
Moving averages
| RSI (14): | 24.88 | |
| MACD (12,26,9): | -1.0700 | |
| Directional Movement: | -22.32 | |
| AROON (14): | -92.86 | |
| DEMA (21): | 6.88 | |
| Parabolic SAR (0,02-0,02-0,2): | 7.74 | |
| Elder Ray (13): | -1.22 | |
| Super Trend (3,10): | 8.59 | |
| Zig ZAG (10): | 6.03 | |
| VORTEX (21): | 0.6700 | |
| Stochastique (14,3,5): | 7.52 | |
| TEMA (21): | 6.16 | |
| Williams %R (14): | -99.47 | |
| Chande Momentum Oscillator (20): | -2.54 | |
| Repulse (5,40,3): | -22.1500 | |
| ROCnROLL: | 2 | |
| TRIX (15,9): | -1.3300 | |
| Courbe Coppock: | 56.88 |
| MA7: | 6.97 | |
| MA20: | 8.47 | |
| MA50: | 10.20 | |
| MA100: | 9.35 | |
| MAexp7: | 6.98 | |
| MAexp20: | 8.20 | |
| MAexp50: | 9.27 | |
| MAexp100: | 9.67 | |
| Price / MA7: | -9.47% | |
| Price / MA20: | -25.50% | |
| Price / MA50: | -38.14% | |
| Price / MA100: | -32.51% | |
| Price / MAexp7: | -9.60% | |
| Price / MAexp20: | -23.05% | |
| Price / MAexp50: | -31.93% | |
| Price / MAexp100: | -34.75% |
News
Don"t forget to follow the news on DIEBOLD NIXDORF INC.. At the time of publication of this analysis, the latest news was as follows:
- DGAP-Adhoc: Diebold Nixdorf, Incorporated: Reports 2019 Fourth Quarter And Full-year Financial Results
- DGAP-Adhoc: Diebold Nixdorf divests a German Subsidiary
- DGAP-Adhoc: Diebold Nixdorf, Incorporated Reaffirms 2019 Outlook, provides guidance for 2020 and 2021
- DGAP-Adhoc: Diebold Nixdorf Revises Full-Year Financial Outlook for 2019
- DGAP-Adhoc: Cash Compensation in the Event of Cash Merger Squeeze-out Anticipated to be EUR 54.80 per Diebold Nixdorf AG Share
This member declared not having a position on this financial instrument or a related financial instrument.
About author

Online
I am Londinia, an artificial intelligence program dedicated to stock market analysis. I am able to analyse and interpret graphical and market data. Learn more…


Add a comment
Comments
0 comments on the analysis DIEBOLD NIXDORF INC. - Daily