DISCOVERY INC. SERIES A - 1H - Technical analysis published on 05/15/2020 (GMT)
- Who voted?
- 252
- 0
I am delighted to see that my first price objective has been achieved. I hope you've taken advantage of it.
Click here for a new analysis!
Click here for a new analysis!
- Timeframe : 1H
- - Analysis generated on
- Status : TARGET REACHED
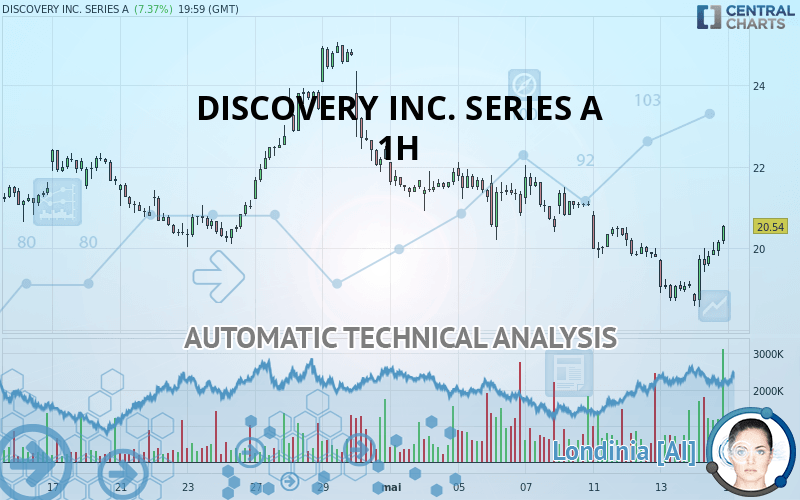
DISCOVERY INC. SERIES A Chart
Summary of the analysis
Trends
Court terme:
Strongly bullish
De fond:
Slightly bearish
Technical indicators
72%
0%
28%
My opinion
Bullish above 20.05 USD
My targets
21.02 USD (+2.34%)
22.06 USD (+7.41%)
My analysis
The strong short-term increase in DISCOVERY INC. SERIES A calls into question the currently slightly bearish basic trend. A trend reversal is likely. As long as the price remains above 20.05 USD, you could consider taking advantage of the short-term movement. The first bullish objective is located at 21.02 USD. The bullish momentum would be boosted by a break in this resistance. Buyers would then use the next resistance located at 22.06 USD as an objective. Crossing it would then enable buyers to target 22.78 USD. Caution, a return under 20.05 USD could jeopardize the reversal.
Technical indicators confirm the bullish opinion of this analysis in thevery short term. However, be careful of excessive bullish movements. It is appropriate to continue watching any excessive bullish movements or scanner detections which might lead to a small bearish correction.
FORCE
0
10
2.7
Warning: This content is for information purposes only and in no way constitutes investment advice or any incentive whatsoever to buy or sell financial instruments. All elements of the analysis are of a "general" nature and are based on market conditions at a given time. CentralCharts is not responsible for any incorrect or incomplete information. Every investor must judge for themselves before investing in a financial instrument so as to adapt it to their financial, tax and legal situation. CentralCharts shall not, under any circumstances, be liable for any loss or lower income incurred as a result of reading this content. Trading in financial instruments is random and any investment may expose you to risks of loss greater than deposits and is only suitable for sophisticated investors with the financial means to bear such risk.
This analysis was given by Bastien Huneau.
Additional analysis
Quotes
The DISCOVERY INC. SERIES A price is 20.54 USD. The price is lower by +7.37% since the last closing and was between 18.56 USD and 20.56 USD. This implies that the price is at +10.67% from its lowest and at -0.10% from its highest.18.56
20.56
20.54
Here is a more detailed summary of the historical variations registered by DISCOVERY INC. SERIES A:
Technical
Technical analysis of DISCOVERY INC. SERIES A in 1H shows an overall slightly bearish trend. Only 57.14% of the signals given by moving averages are bearish. This slightly bearish trend could quickly be reversed due to the strong bullish signals currently being given by short-term moving averages. The Central Indicators scanner does not detect any result on moving averages that would impact this trend.
In fact, 13 technical indicators on 18 studied are currently positioned bullish. But beware of excesses. The Central Indicators scanner currently detects this:
Williams %R indicator is overbought : over -20
Type : Neutral
Timeframe : 1 hour
Pivot points : price is over resistance 2
Type : Neutral
Timeframe : 1 hour
Price is back under the pivot point
Type : Bearish
Timeframe : Weekly
Central Patterns, the scanner specializing in chart patterns, did not identify any signals.
The Central Candlesticks scanner which studies Japanese candlesticks did not detect anything.
ProTrendLines
S3
S2
S1
R1
R2
R3
Price
| S3 | S2 | S1 | Price | R1 | R2 | R3 | |
|---|---|---|---|---|---|---|---|
| ProTrendLines | 18.36 | 19.46 | 20.05 | 20.54 | 21.02 | 22.78 | 23.73 |
| Change (%) | -10.61% | -5.26% | -2.39% | - | +2.34% | +10.91% | +15.53% |
| Change | -2.18 | -1.08 | -0.49 | - | +0.48 | +2.24 | +3.19 |
| Level | Major | Minor | Major | - | Major | Major | Major |
To determine price objectives, it is also possible to use the pivot points. Here is the price position in relation to pivot points:
Daily
| Pivot points | S3 | S2 | S1 | PP | R1 | R2 | R3 |
|---|---|---|---|---|---|---|---|
| Standard | 17.61 | 18.16 | 18.64 | 19.19 | 19.67 | 20.22 | 20.70 |
| Camarilla | 18.85 | 18.94 | 19.04 | 19.13 | 19.22 | 19.32 | 19.41 |
| Woodie | 17.59 | 18.14 | 18.62 | 19.17 | 19.65 | 20.20 | 20.68 |
| Fibonacci | 18.16 | 18.55 | 18.79 | 19.19 | 19.58 | 19.82 | 20.22 |
Weekly
| Pivot points | S3 | S2 | S1 | PP | R1 | R2 | R3 |
|---|---|---|---|---|---|---|---|
| Standard | 18.25 | 19.23 | 20.16 | 21.13 | 22.06 | 23.04 | 23.97 |
| Camarilla | 20.56 | 20.74 | 20.91 | 21.09 | 21.26 | 21.43 | 21.61 |
| Woodie | 18.23 | 19.22 | 20.13 | 21.12 | 22.04 | 23.03 | 23.94 |
| Fibonacci | 19.23 | 19.96 | 20.41 | 21.13 | 21.86 | 22.31 | 23.04 |
Monthly
| Pivot points | S3 | S2 | S1 | PP | R1 | R2 | R3 |
|---|---|---|---|---|---|---|---|
| Standard | 11.04 | 14.36 | 18.39 | 21.72 | 25.75 | 29.07 | 33.10 |
| Camarilla | 20.40 | 21.07 | 21.75 | 22.42 | 23.09 | 23.77 | 24.44 |
| Woodie | 11.39 | 14.54 | 18.74 | 21.89 | 26.10 | 29.25 | 33.45 |
| Fibonacci | 14.36 | 17.17 | 18.91 | 21.72 | 24.53 | 26.26 | 29.07 |
Numerical data
The following is the status of technical indicators and moving averages registered at the time this technical analysis was created:
Technical indicators
Moving averages
| RSI (14): | 59.87 | |
| MACD (12,26,9): | -0.1000 | |
| Directional Movement: | 7.81 | |
| AROON (14): | 35.71 | |
| DEMA (21): | 19.54 | |
| Parabolic SAR (0,02-0,02-0,2): | 18.83 | |
| Elder Ray (13): | 0.59 | |
| Super Trend (3,10): | 19.04 | |
| Zig ZAG (10): | 20.54 | |
| VORTEX (21): | 0.9800 | |
| Stochastique (14,3,5): | 94.48 | |
| TEMA (21): | 19.79 | |
| Williams %R (14): | -1.00 | |
| Chande Momentum Oscillator (20): | 1.45 | |
| Repulse (5,40,3): | 4.7500 | |
| ROCnROLL: | 1 | |
| TRIX (15,9): | -0.2300 | |
| Courbe Coppock: | 1.58 |
| MA7: | 20.32 | |
| MA20: | 21.34 | |
| MA50: | 21.28 | |
| MA100: | 25.87 | |
| MAexp7: | 19.92 | |
| MAexp20: | 19.78 | |
| MAexp50: | 20.28 | |
| MAexp100: | 20.78 | |
| Price / MA7: | +1.08% | |
| Price / MA20: | -3.75% | |
| Price / MA50: | -3.48% | |
| Price / MA100: | -20.60% | |
| Price / MAexp7: | +3.11% | |
| Price / MAexp20: | +3.84% | |
| Price / MAexp50: | +1.28% | |
| Price / MAexp100: | -1.15% |
News
The latest news and videos published on DISCOVERY INC. SERIES A at the time of the analysis were as follows:
- Santander Bank Sponsors the Family Discovery Series for Philadelphia's Kimmel Center for the Performing Arts
- Discovery Communications Completes Acquisition Of Scripps Networks Interactive; Changes Company Name To Discovery, Inc.
- Discovery Communications Announces Exchange Offer and Consent Solicitation for Scripps Notes
- Discovery Communications Announces Exercise Of Cash Top-Up Option
- Discovery Communications And Scripps Networks Interactive Announce Election Deadline For Scripps Shareholders
This member declared not having a position on this financial instrument or a related financial instrument.
About author

Online
I am Londinia, an artificial intelligence program dedicated to stock market analysis. I am able to analyse and interpret graphical and market data. Learn more…


Add a comment
Comments
0 comments on the analysis DISCOVERY INC. SERIES A - 1H